Explore Main Form
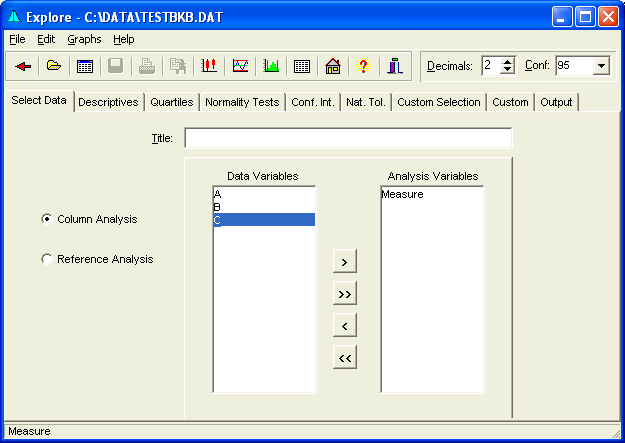
The Explore Form provides a number of statistical analyses and graphical displays of data. Data is read from the Data Editor. Numerous descriptive statistics and distribution tests are available. For more information, see Data File Layout, Statistic Descriptions, Graphics Overview, and Normality Testing Guidelines.
Statistics are displayed in Grids. The Rows and Columns of these grids can be moved be pressing the right mouse button, ![]() , and dragging. Grid Selections can be also be copied.
, and dragging. Grid Selections can be also be copied.
Recalculation is performed when the number of decimal places change, or ![]() or
or ![]() is pressed.
is pressed.

Menu
- File provides the ability Save or Print the output, access the Data Editor, or return to the Main Form.
- Edit provides ability to Copy the grid selection, or Select the entire grid with headings. Font size in the grids can be increased or decreased. Column widths may be minimized for greater column display.
- Graph provides access to Plots Form, Variables Control Chart Form, Histogram Form, and the Frequency Plots Form
- Help provides access to this Website.
Speed Buttons
These buttons provide quick access to the following tasks.
 Returns to calling form or the Main Form.
 Opens a Data File.
 Displays the Data Editor.
 Saves the output to a file.
 Prints the Text.
 Copies Selection to the clipboard.
 Displays the Plots Form.
 Displays the Variables Control Charts Form.
 Displays the Histogram Form.
 Displays the Frequency Plots Form.
 Brings up the Main Form.
 Brings up the Help file.
 Hides the form.
Decimal Place Change
Changes the number of decimal places, from 0 to 9. Change may be made by selecting and typing in the number, or by using the incrementing buttons.
Confidence Level
The confidence level used in calculations may be entered here. The value is expressed in percent. The confidence level may be changed by selecting and typing in the level, or by using a drop-down selection.
Select Data Tab
Select this Tab to configure the variables to use in analysis. Data may be analyzed in columns or with the use of reference columns.
(See Data File Layout.)
Descriptives Tab
This tab displays:
- n
- Mean
- Standard Deviation
- Low
- High
- Range
(See Statistic Descriptions.)

Quartiles Tab
This tab displays:
- n
- Low
- Q1
- Median
- Q3
- High
(See Statistic Descriptions.)

Normality Tests Tab
This tab displays:
- Anderson-Darling Test for Normality
- Shapiro-Wilk Test for Normality
- Lin-Mudholkar Test for Normality
- Skewness and Kurtosis Tests for Normality
(See also Normality Testing Guidelines.)

* p-values less than (1-Confidence) level will be displayed in Yellow and with a asterisk.
Confidence Intervals Tab
This tab displays:
- n
- Mean
- Mean Confidence Interval (low)
- Mean Confidence Interval (high)
- Standard Deviation
- Standard Deviation Confidence Interval (low)
- Standard Deviation Confidence Interval (high)
If the Use Pooled Variance checkbox is selected, the pooled variance from all groups will be used in the calculations. (All standard deviation values will be identical when this option is selected.)
(See Confidence Intervals.)

Natural Tolerance Tab
This tab displays:
- n
- Mean
- Standard Deviation
- Lower Process Limit (Assuming Normality)
- Upper Process Limit (Assuming Normality)
- Natural Tolerance Range (6s)
If the Use Pooled Variance checkbox is selected, the pooled variance from all groups will be used in the calculations.
(See What are Natural Tolerances?)

Custom Selection Tab
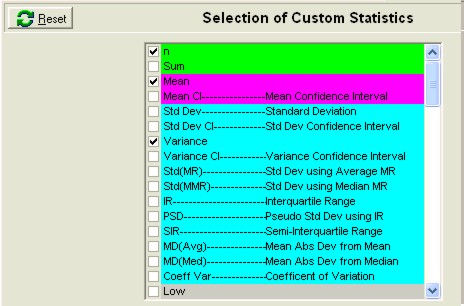
Select this tab to configure output on the Custom Tab. When the checkboxes are checked, the corresponding statistics will appear on the Custom Tab. The statistics are grouped within color coded sections.
(See Statistic Descriptions.)

Custom Tab
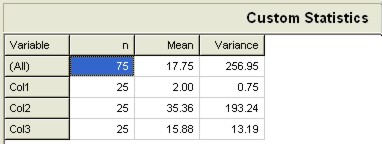
Select this tab to view various statistics selected on the Custom Selection Tab.
(See Statistic Descriptions.)

Output Tab
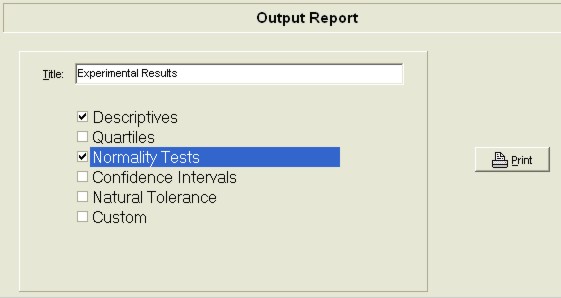
Select this tab to output a report.

Title
Enter a title here to be used in the Graphic Plots and Output Report.
Column/Reference Analysis
Select whether data is to be analyzed by Columns or using Reference Index values. See Data File Layout.
Data Variables
These are the Data Variables, found in the Data Editor, which may be used in analysis.
Selection Buttons
Click these buttons to move variables between the Data Variables and the Analysis Variables.
Analysis Variables
These are the variables selected for analysis.
Explore Form Status Bar
This status bar will display the variables selected and any file modifications such as "Process If," and "Transforms."
