Histogram Plot - Form
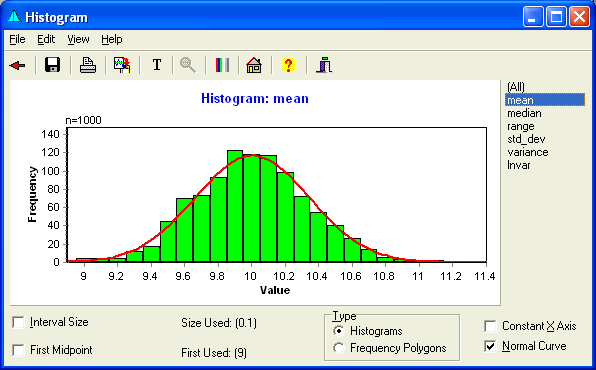
histograms are displayed on the following form. The Specifications and target will be displayed if entered. A custom interval size, and first interval may be selected. The frequencies or relative frequencies may be selected. Double-clicking on the graph will copy the graph to the clipboard.

Menu
- File allows Saving and Printing the chart, or Returning to the calling form.
- Edit allows Copying the chart or Editing the Titles.
- View allows the ability to Zoom Out, select Black & White colors, add File Modifications to the chart.
- Help calls up this Help file.
Speed Buttons
- The buttons provide quick access to common tasks. Clicking these buttons do the following tasks:
 Returns to the Explore Form.
 Saves the chart to a file.
 Prints the chart.
 Copies the chart to the clipboard.
 Edits the Titles.
 Zooms out the chart following a Zoom.
 Toggles between Color and Black & White.
 Brings up the Main Form
 Brings up the Help file.
 Hides the form.
Histogram Title
The title will be added here above the word Histogram. This title may be edited.
Variable Selection
Variables may be selected from this list for display in the chart. Clicking an item on this list will redraw the chart.
Histogram Frequency Scale
This is the scale used to plot the Histogram bars. This scale shows either the number of observations in each plotted bar or the relative frequencies per bar (an option on the View menu).
Histogram X-Axis
This is the X-Axis scale used to plot the Histogram.
Histogram Plot
This displays the Histogram or Frequency Plot. A superimposed normal curve is optional.
Histogram Interval Size Selection
An optional Interval size may be entered into this box. Entering a value of zero generates a Histogram using the default interval size.
Histogram Interval Size Used
The Interval Size used in the display is shown here.
Histogram Type
Select a Histogram or Frequency Polygon.
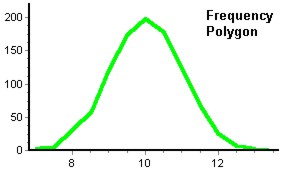
A Frequency Polygon is displayed as shown below.

Histogram Constant X-Axis
Checking this Checkbox will fix the X-Axis so multiple groups can be checked using the same scale.
Histogram Normal Curve
When this is Checked, a Normal Curve will be superimposed in Red on the Histogram.
Histogram First Interval
The first interval used may be set here. If greater than the smallest value, a smaller value will be used that is a multiple of the interval size selected and which will generate an interval midpoint of the selected value.
Histogram First Interval Used
The First Interval used in the display is shown here.
Histogram Sample Size
The sample size of the data in the histogram will be displayed here.
