Statistic Descriptions
The following a brief discussion of statistics found in the Explore routines. Confidence intervals are also available for the Mean, Standard Deviation, and Variance.
Included on this page are:
Measures of Location
Mean
The mean is also known as the average, calculated as follows.

Median
50% of the data fall at or above the median and 50% of the data fall at or below the median. The median is found in the (n+1)/2 position in the data, when the data is sorted from low to high.
Interpolated Median
When data are grouped an interpolated median may be used. This is also useful for low resolution data as implemented in MVPstats, where several values fall at the median. The following formula is used.
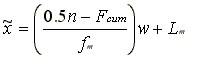
Where
- n = sample size,
- Fcum = sum of the frequencies up to, but not including, the median value,
- w = resolution, found by finding the minimum non-zero differences between sorted values, and
- fm = frequency at the median,
- Lm = Lower limit of the the median interval, which is the median minus w/2.
Measures of Position
Low
Lowest value in the data set.
Xlow
High
Highest value in the data set.
Xhigh
Q1
Q1 is the first quartile. It is the value at or below which 25% of the data fall. Q1 is using the (n+1)/4 position in a data set sorted from low to high and interpolating.
Q3
Q3 is the third quartile. It is the value at or above which 25% of the data fall. Q3 is found in the 3(n+1)/4 position in a data set sorted from low to high and interpolating.
Percentiles
The Pth percentile is the value that P% of the values fall at or below, and (100-P%) fall above it.
Percentiles are found by sorting the data from low to high, and interpolating when necessary. The Pth percentile may be found in the P(n+1)/100th position, where P is expressed as a percent. If the percentile position is not an integer the percentile falls between two values. In this case, the fraction generated in the position calculation yields the fraction of the difference between the two values. If P is less than 100/(n+1) or greater than 100 n /(n+1), P is undefined.
Measures of Variability
Range
The Highest minus the lowest value.
R = Xhigh - Xlow
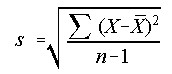
Std Dev - Standard Deviation
The standard deviation is a measures of variability. It is the square-root of the average squared distance each value falls from the mean.
Variance
The variance is simply the standard deviation squared.
![]()
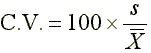
Coefficient of Variation
The coefficient of variation is calculated as follows.
Std(MR) - Std Dev using Average MR
The is another estimate of the standard deviation, using the average Moving Range (the average of the moving absolute difference of sequential values).

where
 is the average moving range, and
 is a constant equal to 1.128 (using moving ranges between two points).
Std(MMR) - Std Dev using Median MR
This is another method to estimate the standard deviation, similar to Std(MR), except the median of the moving ranges is used.

where
 is the median moving range, and
 is a constant equal to 0.954 (using moving ranges between two points).
IR - Interquartile Range
This is the range of the middle 50% of the data.
IR = Q3 - Q1
PSD - Psuedo Std Dev using IR
This is another method to estimate standard using the Interquartile Range divided by a constant, assuming a normal distribution.
PSD = (Q3 - Q1) / 1.3489795
SIR - Semi-Interquartile Range
This is simply 1/2 the Interquartile range.
SIR = IR / 2
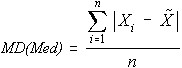
MD(Med) - Mean Abs Dev about Median
This measure is related to the standard deviation, except it measures absolute deviations around the median. The MD(Med) is calculated as follows.
MD(Avg) - Mean Abs Dev about Average
This measure is related to the standard deviation, except it measures absolute deviations around the mean or average. The MD(Avg) is calculated as follows.
Calc.jpg)
Measures of Shape
Skewness (See Skewness & Kurtosis)
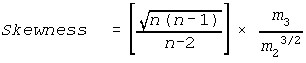
Where
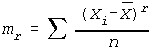
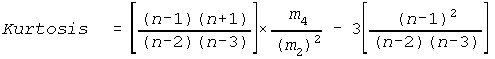
Kurtosis (See Skewness & Kurtosis)
Distribution Testing Statistics
A-D - Anderson-Darling Test for Normality Test Statistic
L-M - Lin-Mudholkar Test for Normality Test Statistic
W(E) - Shapiro-Wilk Test for Exponentiality Test Statistic
Poisson Test Statistic - See Poisson Distribution Test.
Natural Tolerance Statistics
-4s, -3s, -2s, -1s, +1s, +2s, +3s, +4s
These are the values corresponding to given standard deviations from the mean, as follows.
As = Mean + As
where “A” is a positive or negative number
4s, 6s, 8s
These may be used for natural tolerances, assuming normality.
NT = As
n below -3s, n above +3s
This is the count of observations below 3 standard deviations, or above 3 standard deviations.
Capability and Performance Statistics
LSL, Target, USL
These are the Entered Specifications.
n Below Spec, n Above Spec, n Out Spec, % Below Spec, % Above Spec, % Out Spec
These are the count or percent of observations below, above, or total outside of specifications.
Est %Below Spec, Est %Above Spec, Est %Out Spec
These are estimated proportions outside of specifications, assuming normality.
Cp, Cpk, Cpm
These are capability measures, estimated using sample statistics.
pp, ppk, ppm
These are performance measures, which are calculated the same as capability measures using sample statistics.
See ppm, ppk, pp, %Off-Target
