What are Box & Whisker Plots?
The Box and Whisker plot was introduced by John Tukey in 1977. It is a graphical display of the Low, High, Q1, Q3, Median, and outlier points. It is particularly useful at comparing several groups.
Two versions of the Box and Whisker Plot are displayed. The first displays the plot without the outlier points displayed. The second shows outlier points.
Here is a diagram of a Box and Whisker Plot.
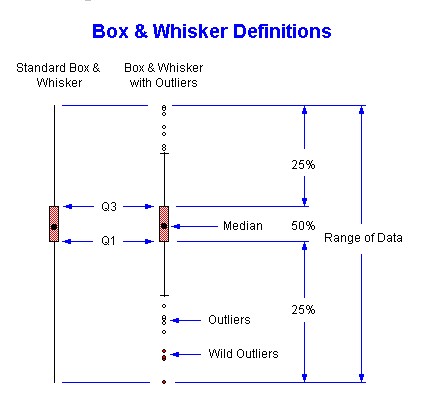
Q1 is the first quartile. It is the value at or below which 25% of the data fall. Q3 is the third quartile. It is the value at or above which 25% of the data fall. The range, Q1 to Q3, is called the interquartile range and represents 50% of the data.
The interquartile range is displayed by boxes. The Dot within the box is the median. 50% of the data fall at or above the median and 50% of the data fall at or below the median. The median is found in the (n+1)/2 position in the data, when the data is sorted from low to high.
Q1 is found in this software using the (n+1)/4 position in a data set sorted from low to high and interpolating. Q3 is found in the 3(n+1)/4 position in a data set sorted from low to high and interpolating. This is different than Tukey's technique of finding the medians of the lower and upper halves of the data (above and below the median) to establish what Tukey called "Hinges". Hinges are approximately equal to the quartiles.
Inner Fences are found by multiplying the interquartile range by 1.5 and adding this to Q3 or subtracting this from Q1. This is plotted with a 'T', but does not extend beyond the limits of the data. Any values found outside that range is an outlier.
Adding or subtracting three times the interquartile range to the quartiles defines Outer Fences. Values falling between the Inner and Outer Fences are mild outliers, displayed as an open circle. Any values found outside this range are considered wild outliers, displayed as red or solid circle.
If the population was normal and its quartiles were equal to those of the sample, mild outliers should occur no more than 7 times per 1000, and wild outliers should occur no more than twice per million.
