Control Limit Calculations Variables Charts
The following are methods used to calculate control limits for variables charts. The variables charts covered include the X-bar, X-tilde (Median), X, R, s, and s2.
Centerline
The centerline will typically be the Mean or the Median (Default) of the plotted statistic.
Spread of the Limits
The spread of the limits is based upon two factors. The first is the number of standard errors, and the second is the estimation of the standard deviation.
Number of Standard Errors
Typically, the number of standard errors is set to three (Default). A more sensitive chart may be generated using a number somewhat less than this, such as two. The trade-off in using a number smaller than three is increasing the number of false signals (a stable process designated as unstable).
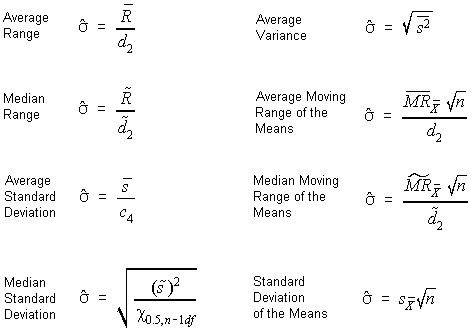
Estimating the Standard Deviation
The standard deviation may be estimated with a number of different statistics. Here are various methods using different statistics.
Control Limit Equations
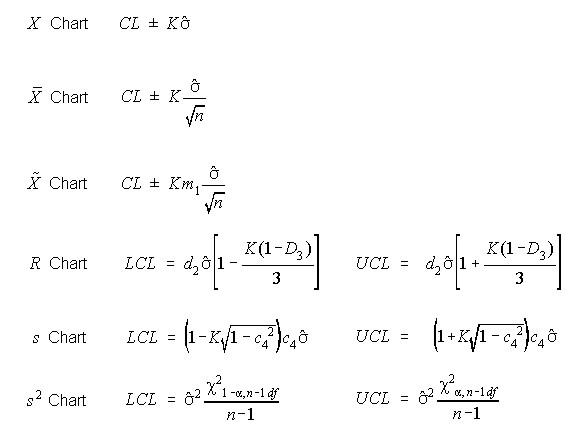
Where:
K is the number of standard errors,
![]() is the estimated standard deviation,
is the estimated standard deviation,
n is the sample size,
![]() is a constant used to obtain the standard error of the median, and is a function of sample size,
is a constant used to obtain the standard error of the median, and is a function of sample size,
![]() is a constant which is the ratio between an average range and the standard deviation, and is a function of sample size,
is a constant which is the ratio between an average range and the standard deviation, and is a function of sample size,
![]() is a constant used to estimate the variation in the Range, and is a function of sample size, and
is a constant used to estimate the variation in the Range, and is a function of sample size, and
![]() is a constant which is the ratio between an average range and the standard deviation, and is a function of sample size.
is a constant which is the ratio between an average range and the standard deviation, and is a function of sample size.
