What are Control Charts?
Control charts display data through time. A process displaying through-time stability or control will exhibit random variation within expected bounds.
Control limits are established which may be used as guides to this expected variation. These limits are calculated using statistical principles. The spread of these limits are determined from statistics of the plotted data. See Control Limit Calculations for Variable Charts and Control Limit Calculations for Attributes Charts.
When nonrandom patterns are observed, these may be thought of as clues to indicate a process change has occurred. When examining a Control chart, statistically based rules may be used which "flag" those points where a change may have occurred. For a list of these rules see Control Chart Rule Violations.
Without statistically based control limits, a plot of through-time data is known as a Run Chart. A Run Chart is simply a time-based line chart.
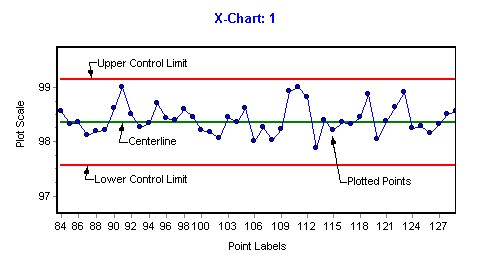
The following is a generic diagram of a Control Chart.