Attributes Chart Form
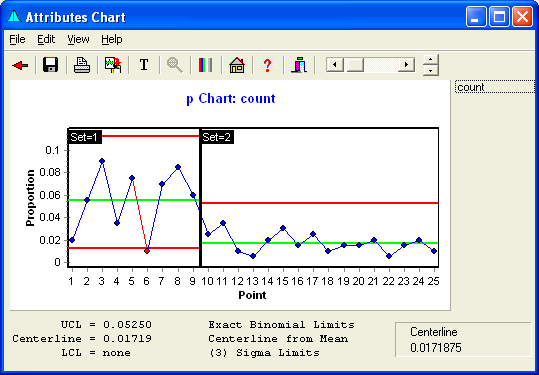
This form displays the Attributes Chart. This form will appear when the Action button is clicked on the Attributes Chart Setup form.

Clicking a Point will bring up the following dialog to enter text. This text will remain until cleared through the Edit menu.

Menu
- File: Provides ability to save or print the chart.
- Edit: Copies the chart (which also may be achieved by double clicking on the chart), provides the ability to copy control limit text, and edit the chart titles.
- View: Zoom out after zooming, toggle black-and-white display, display or hide the control rule violations, connect or not connect the points, show breaks option to show gaps with missing data, change decimal places on the Y-Axis scale, and control limit or file modifications to the chart.
- Help: Calls up this Website.
Speed Buttons
The buttons provide quick access to common tasks. Clicking these buttons do the following tasks:
 Returns to the Attributes Chart Setup Form.
 Saves the graph to a file.
 Prints the graph.
 Copies the graph to the clipboard.
 Edits the Graph Titles.
 Zooms out the graph following a Zoom.
 Toggles between Color and Black & White
 Brings up the Main Form.
 Brings up the Help file.
 Hides the form.
Point Size
Move the slider to change the size of the plotted points.
Line Thickness Control
The line thickness can be changed by clicking these up and down buttons.
Variables
The variables or groups to be displayed may be selected here.
Control Limit Display
The control limits will be displayed here. These limits may be copied to the clipboard. Note that when multiple sets are present, the control limits of the last set will be displayed.
Control Chart
This is where the control chart graph is displayed. The picture here shows a p chart with multiple sets. Two points are flagged as an out-of-control condition.
Click the title to edit the Chart and Axis titles.
Point Info
The line name and Y values of a point will be displayed here when the cursor is over a plotted point. The cursor will display as a cross (+) when over the point.
Graph Title Edit
Clicking on the Chart Title brings up a Chart Title Edit Form to edit the Titles.
