PERFORM Output
Graphics Output
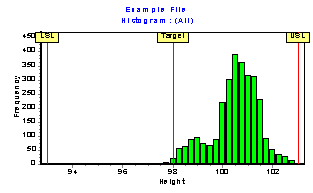
Histograms of combined data or individual process streams, with specification limits
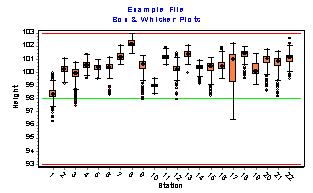
Box-and-Whisker Plots with specification limits
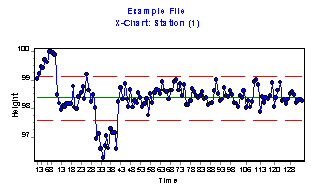
X-Charts by Process Stream
Run charts by Process Stream, with specification limits
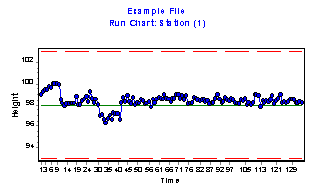
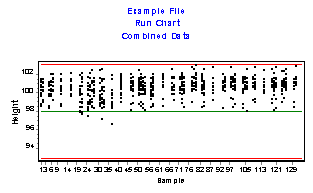
Combined data showing all process streams through time
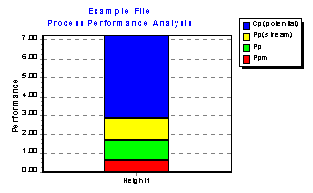
Process Performance Analysis stacked bar chart
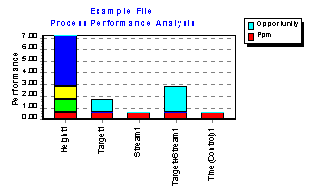
Process Performance Analysis opportunity bar Charts
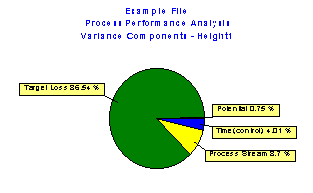
Process Performance Analysis variance components
PROCESS PERFORMANCE ANALYSIS
7/27/98
Title:
   Example File
Data File:
   D:\data\Example.dat
Variables:
   Measures:     Height
   Groups:     Station   1 to 22
Specifications:
    USL = 103.0000   Target = 98.0000
        LSL = 93.0000
Process Stream Analysis:
Group  n  Mean   Low  High Range  Std Std(MMR)
      1 134  98.37  96.26  99.98 3.72 0.63  0.26
      2 134 100.22  99.15 101.08 1.93 0.40  0.24
      3 134  99.73  97.48 100.79 3.31 0.77  0.26
      4 134 100.56  99.55 101.39 1.84 0.29  0.22
      5 134 100.36  99.50 100.99 1.49 0.29  0.23
      6 134 100.29  98.29 101.21 2.92 0.59  0.24
      7 134 101.22 100.63 102.06 1.43 0.33  0.24
      8 134 102.21 101.50 102.94 1.44 0.32  0.26
      9 134 100.34  97.93 101.26 3.33 0.79  0.18
     10 134  98.97  98.38  99.58 1.20 0.24  0.15
     11 134 101.18 100.61 101.94 1.33 0.26  0.21
     12 134 100.16  97.93 101.48 3.55 0.67  0.25
     13 134 101.38  99.94 102.06 2.12 0.28  0.24
     14 134 100.33  99.15 100.93 1.78 0.34  0.23
     15 134 100.27  98.26 101.14 2.88 0.68  0.23
     16 134 100.56  99.59 101.94 2.35 0.45  0.19
     17 134 100.47  96.41 102.20 5.79 1.27  0.23
     18 134 101.30  99.55 101.96 2.41 0.49  0.22
     19 134 100.25  99.15 101.43 2.28 0.54  0.21
     20 134 100.80  98.61 101.76 3.15 0.71  0.24
     21 134 100.57  98.19 101.61 3.42 0.80  0.27
     22 134 101.06  99.53 102.63 3.10 0.49  0.27

   SQRT(MSW) = Avg Std Dev within = 0.58
   AVG Std(MMR) = Avg Std Dev from Median Moving Range = 0.23

Descriptives:
            n = 2948
         Mean = 100.4816
     Std. Dev = 0.9788
          Low = 96.2600
           Q1 = 100.0650
       Median = 100.5900
           Q3 = 101.1400
         High = 102.9400
     Skewness = -0.732
     Kurtosis = 0.759

Variance Components:
   Total Variance About Target = 7.1165 100.00%
           Off-target Variance = 6.1584  86.54%
            Potential Variance = 0.0534  0.75%
       Process Stream Variance = 0.6190  8.70%
        Time(Control) Variance = 0.2856  4.01%

Performance:
                %Off-Target = 24.82%
            Max Stream Mean = 102.2103
            Min Stream Mean = 98.3680
 %Process Stream Difference = 38.42%

                     Ppk    = 0.858
                     Ppm    = 0.625
                      Pp    = 1.703
                  Pp(Stream)= 2.862
                   Cp(pot)  = 7.212
                          n = 2948

                  Above USL = 0
                  Below LSL = 0
                  Total Out = 0   (0 ppm)