Test Statistics - Form
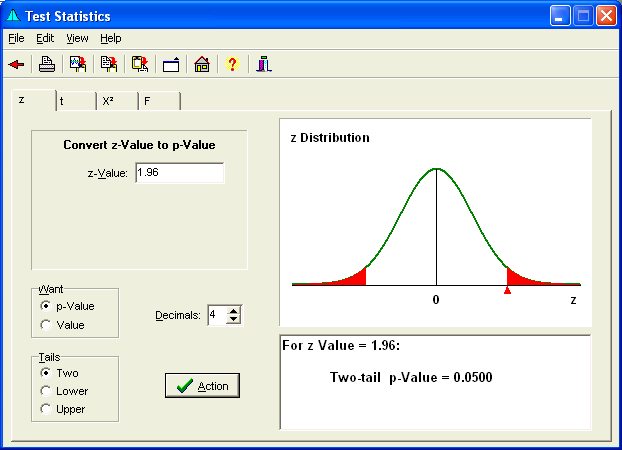
The Test Statistic Form provides the ability to generate Test Statistic p-values or Values.
The z, t, ![]() , and F statistics are available by selecting the associated tabs. Two-tailed, Lower, and Upper values are also available.
, and F statistics are available by selecting the associated tabs. Two-tailed, Lower, and Upper values are also available.

Menu
- File provides the ability to Print the Graph and Text, or return to the Main Form.
- Edit allows Editing Output Text by cutting, copying, pasting, and undoing entry, and provides the abililty to Copy the Graph to the Windows Clipboard.
- View: Provides the ability to enlarge the Form size for easier viewing.
- Help provides access to this Website.
Speed Buttons
- These buttons provide quick access to the following tasks.
 Returns to the Main Form.
 Prints the Graph and Text.
 Copies the Graph to the Clipboard.
 Copies the Selected Text to the clipboard.
 Enlarges/Reduces Form size for easier viewing.
 Brings up the Main Form.
 Brings up the Help file.
 Hides the form.
z Tab
Select this tab for z Test Statistics.
t Tab
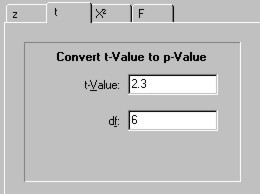
Select this tab for t Test Statistics.

Chi-Square Tab
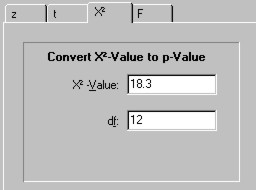
Select this tab for  Test Statistics.

F Tab
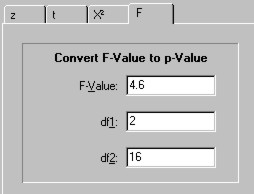
Select this tab for F Test Statistics.

Title
This title will show the desired conversion, to a p-value or value.
Statistic / p-Value
Enter the Test Statistic or p-Values here.
Want
Select whether p-Values or Test Statistic Values are desired.
Tails
Select whether Two-tailed, Lower, or Upper values are desired.
Decimal Place Change
Changes the number of decimal places, from 0 to 9. Change may be made by selecting and typing in the number, or by using the incrementing buttons.
Action Button
Performs calculations and displays output.
Distribution Graph
The distribution graph is displayed here. The tail areas will be shown in Red. Double clicking on this graph will copy it to the clipboard.
Output Text
The calculation output is displayed here when  is clicked. You may save, print, edit, cut, copy, and paste text in this area.
