Control Limit Calculations Attributes Charts
The following are methods used to calculate control limits for attributes charts. The attributes charts covered include the p, np, c, and u.
These control limits may be generated using approximate and exact limit calculations. The exact limits for the p and np charts are based on the Binomial Distribution. The exact limits for the c and u charts are based on the Poisson Distribution.
Centerline
The centerline will typically be the Mean or the Median (Default) of the plotted statistic.
Spread of the Limits
The spread of the limits is based upon the desired number of standard errors, and the estimate of the standard error, or sampling error, of the statistic.
Number of Standard Errors
Typically, the number of standard errors is set to three (Default). A more sensitive chart may be generated using a number somewhat less than this, such as two. The trade-off in using a number smaller than three is increasing the number of false signals (a stable process designated as unstable).
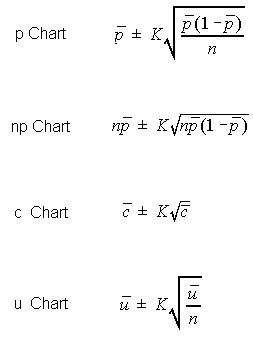
Approximate Control Limit Equations
The following calculations use Normal Approximations for the discrete distributions.
Exact Control Limit Calculations
Exact limits are calculated using the Binomial Distribution or Poisson Distribution. The upper limit is found using these distributions so that a single point has no more than an Alpha/2 chance of falling outside these limits on a single draw.
Alpha is determined by the desired number of standard errors. Three standard errors is would create an Alpha/2 of 0.00135.
The Upper Control Limit is found by finding the value that would have a probability equal and above that would have no more than Alpha/2 chance of occurrence. The Lower Control Limit is found by finding the value that would have a probability equal and below that would have no more than Alpha/2 chance of occurrence.
The point half-way between these values and the next closer value to the centerline is selected as the control limits. Using this method the control limits will fall half-way between two of the discrete possible values.
A c-chart having a c-bar of 12, the point estimate of Lambda, the control limits would be 2.5 and 24.5. This may be seen in the Poisson distribution below.
Poisson Distribution
   Lambda = 12.00000

          Prob        Equal &     Equal &
    X     at X        Above       Below
    0     0.00001     1.00000     0.00001 |
    1     0.00007     0.99999     0.00008 |
    2     0.00044     0.99992     0.00052 |
    3     0.00177     0.99948     0.00229 |-
    4     0.00531     0.99771     0.00760 |--
    5     0.01274     0.99240     0.02034 |----
    6     0.02548     0.97966     0.04582 |--------
    7     0.04368     0.95418     0.08950 |-------------
    8     0.06552     0.91050     0.15503 |--------------------
    9     0.08736     0.84497     0.24239 |---------------------------
   10     0.10484     0.75761     0.34723 |--------------------------------
   11     0.11437     0.65277     0.46160 |-----------------------------------
   12     0.11437     0.53840     0.57597 |-----------------------------------
   13     0.10557     0.42403     0.68154 |--------------------------------
   14     0.09049     0.31846     0.77202 |----------------------------
   15     0.07239     0.22798     0.84442 |----------------------
   16     0.05429     0.15558     0.89871 |-----------------
   17     0.03832     0.10129     0.93703 |------------
   18     0.02555     0.06297     0.96258 |--------
   19     0.01614     0.03742     0.97872 |-----
   20     0.00968     0.02128     0.98840 |---
   21     0.00553     0.01160     0.99393 |--
   22     0.00302     0.00607     0.99695 |-
   23     0.00157     0.00305     0.99853 |
   24     0.00079     0.00147     0.99931 |
   25     0.00038     0.00069     0.99969 |
   26     0.00017     0.00031     0.99987 |
   27     0.00008     0.00013     0.99994 |
   28     0.00003     0.00006     0.99998 |
   29     0.00001     0.00002     0.99999 |
   30     0.00001     0.00001     1.00000 |
   31     0.00000     0.00000     1.00000 |
   \          \           \           \
  Inf.    0.00000     0.00000     1.00000 |
