Sample Size Calculations
Below are the methods used to calculate sample size for various tests.
Means
Estimation
For estimation of a Mean within +/- Delta with a given confidence, only Alpha, Delta, and Sigma (or use a ratio of Delta/Sigma) are needed. Sigma is assumed known. (The t-distribution for an unknown sigma cannot be used for estimation because the t-distribution is concerned with the sample mean deviation from the population mean over a standard deviation estimate, which has nothing to do with the expected variation in sample means. If Sigma is unknown, use a worst case analysis for your Sigma, or simply use the ratio of Delta/Sigma.) The formula used is as follows.
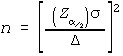
For One and Two-sample sample sizes:
- Select Alpha, Beta, and Delta, and an estimate of Sigma (or use a ratio of Delta/Sigma).
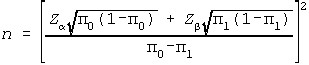
- First calculate sample size assuming a normal test, with sigma assumed known:
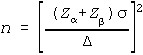
- To obtain the sample size using a t-test, increase n (and degrees of freedom) until the following relationship is obtained:
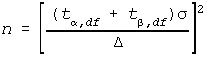
Multiply the sample size value by two for a two sample test and use Alpha/2 for two-sided tests.
Variances
Estimation
The sample size for estimation of a variance or standard deviation requires a selection of Alpha, and the ratio of the true standard deviation over the observed standard deviation. The sample size is found by iteratively finding the sample size where the Chi-square distribution, with n-1 degrees of freedom, produces only an Alpha/2 chance of the observed variance (standard deviation squared).
One-Sample Variance:
For a single-tailed, single sample test for an increase in variance:
- Select Alpha, Beta, and R. R is the effect size, which must be expressed as a ratio of the alternative hypothesis variance to the null variance.
- Generates the critical chi-square value corresponding to alpha, with an arbitrary degrees of freedom equal to, say, 100.
- Divide the critical value by R, use this result as a chi-square value and assess the lower-tail probability to estimate beta, using the above chosen degrees of freedom.
- If the beta generated is too large, increase the degrees of freedom and return to step 3, if too small, reduce degrees of freedom and return to step 3.
- The sample size will be the degrees of freedom plus one.
For two-tailed tests, use Alpha/2 and note that power can be found above and below the chi-square critical values. Power is calculated with one tail in the software.
Two-Sample Variance:
For two-sample F (independent) tests, use a similar procedure to the single sample tests. Note that assumptions of equal sample sizes will be made.
- Select Alpha, Beta, and R. R is the effect size, which must be expressed as a ratio of the alternative hypothesis variances.
- Generate the critical F value corresponding to alpha, with an arbitrary degrees of freedom equal to, say, 100.
- Divides the critical value by R, use this result as an F value and assess the lower-tail probability to estimate beta, using the above chosen degrees of freedom in the numerator and denominator.
- If the beta generated is too large, increase the degrees of freedom and return to step 3, if too small reduce degrees of freedom and return to step 3.
- The sample size will be the degrees of freedom plus one.
Proportions
Estimation
The sample size for estimation of a proportion requires a selection of Alpha, and the estimated true proportion, and an estimated observed proportion. The worst case would be where the true proportion is 0.5. The sample size is found by iteratively finding the sample size where the exact binomial produces only an Alpha/2 chance of the observed proportion.
For the One-Sample Approximate Test for Proportions:
For two-tailed tests, use Alpha/2.
For the One-Sample Exact Binomial Test for Proportions:
Generate n using the exact Binomial Distribution such that no more than Alpha or Beta error rates are achieved. This is done by iteratively selecting sample sizes, generating the Binomial Distribution corresponding to null hypothesis Proportion, Pi(0), with the given sample size, and then finding the critical values corresponding to Alpha or less. A Binomial distribution is then generated with the same sample size with a proportion equal to the alternative proportion, Pi(1). Power is found by examining the proportion falling at the critical value and further in this second distribution.
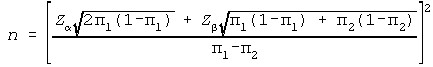
For the Two-Sample Approximate Test for Proportions:
Rates
Estimation
The sample size for estimation of a Rate requires a selection of Alpha, and the estimated true Lambda, and an estimated observed Lambda. The sample size is found by iteratively finding the sample size where the exact Poisson, with mean equal to (n x Lambda(true)), produces only an Alpha/2 chance of (n x Lambda(observed)).
For the One-Sample Exact Poisson Test for Rates:
Generate n using the exact Poisson Distribution such that no more than Alpha or Beta error rates are achieved. This is done by iteratively selecting sample sizes, generating the Poisson Distribution with a Lambda equal to Lambda(0) times the given sample size, and then finding the critical values corresponding to Alpha or less. A Poisson Distribution is then generated with Lambda equal to the alternative Lambda(1) times the same sample size. Power is found by examining the proportion falling at the critical value and further in this second distribution.
For the Two-Sample Test for Rates:
Iteratively select sample sizes and generate the Chi-Square Critical Value. Generate two Poisson distributions, one with Lambda equal to Lambda(1) times n, and the other equal to Lambda(2) times n. Generate the joint probabilities of each combination of values from the two distributions. Find power by summing the probabilities where the Chi-Square critical values are exceeded.
ANOVA
- Select Alpha, Beta, Sigma and Delta (or use a ratio of Delta/Sigma), and the number of Levels or Cells.
- Iteratively Select a Sample Size.
- Generate the Critical F with (Levels-1, Levels*(n-1)) df corresponding to Alpha.
- Calculate the Power using the Non-Central F distribution with the noncentrality parameter:

Continue varying sample size until the desired power is reached.
The ANOVA sample size assumes that two group means depart from the grand mean by 1/2 Delta in opposite directions, with the other group means equal to the grand mean.
Correlations
Estimation
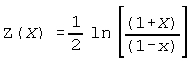
The sample size for estimation of a Pearson correlation (Rho) requires a selection of Alpha, and the estimated true correlation, and an estimated observed correlation. The sample size is found using the following formula.
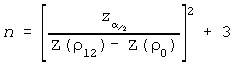
For the One-Sample Correlation Test
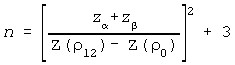
For the Two-Sample Correlation Test
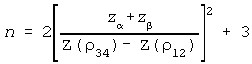
Where: