Control Limit Calculations Form
The Control Limit Calculation Form calculates control limits for numerous control charts, each with a number of different calculation methods.
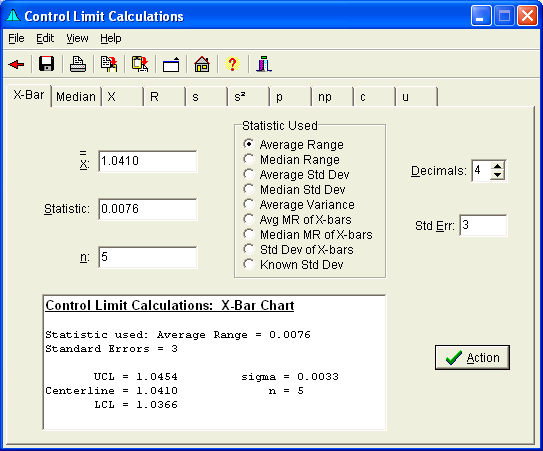
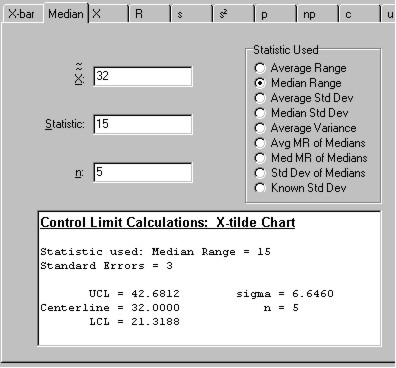
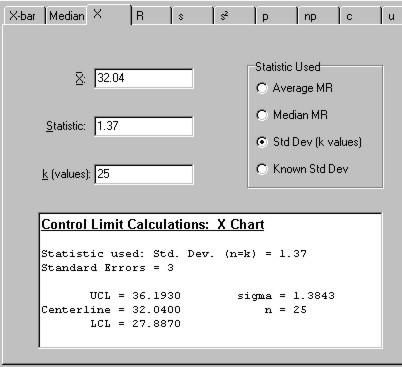
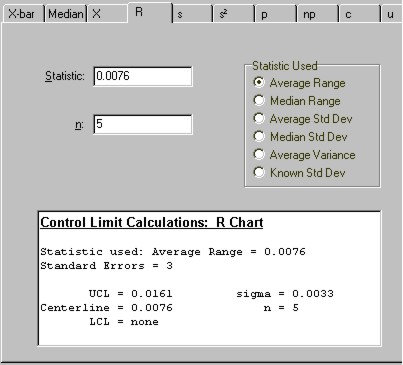
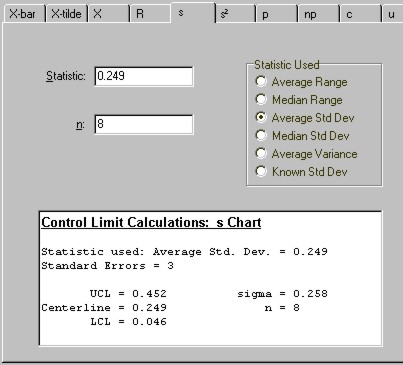
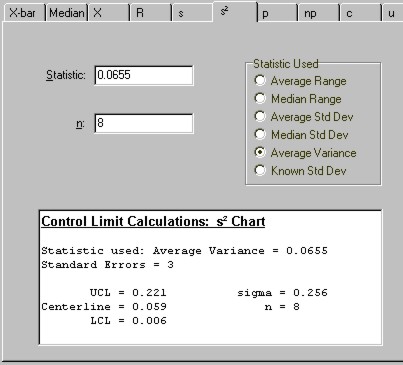
The Variables charts, X-bar, Median, X, R, s, and s2, have a number of different options which can be used to determine the process variation used to determine the control limits. These options include the average and median range, average and median standard deviation, average variance, moving range of the means, standard deviation of the means, or a known standard deviation. Variables charts also provide estimates of the population standard deviation, sigma.
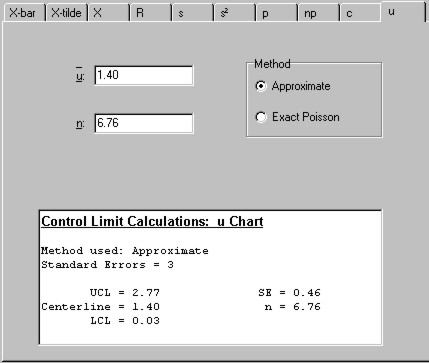
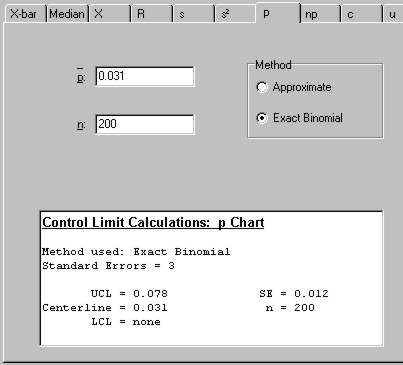
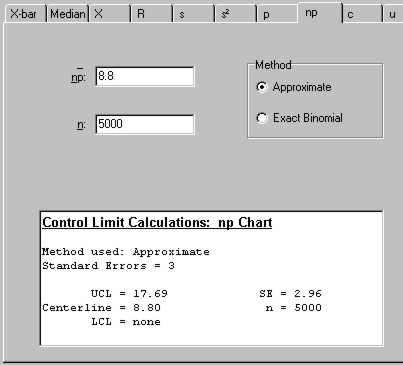
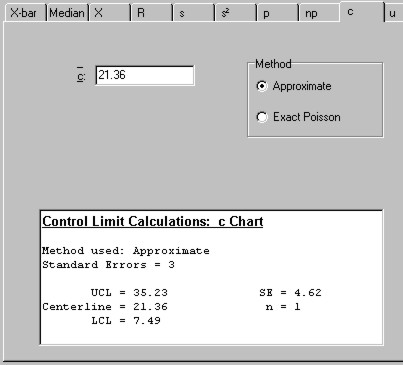
The Attributes control charts have approximate and exact limit calculations as an option. The exact limits for the p and np charts are based on the Binomial Distribution. The exact limits for the c and u charts are based on the Poisson Distribution.
The number of standard errors for each chart may also be modified. The default is 3.
Menu
- File provides the ability Save or Print the output, or return to the Main Form.
- Edit allows Editing Output Text by cutting, copying, pasting, and undoing entry.
- View provides the ability to enlarge/reduce the Form size for easier viewing.
- Help provides access to this Website.
Speed Buttons
- These buttons provide quick access to the following tasks.
 Returns to last Form or the Main Form.
 Saves the output to a file.
 Prints the Text.
 Copies Selection to the clipboard.
 Pastes Text from the clipboard
 Enlarges/Reduces Form size for easier viewing.
 Brings up the Main Form.
 Brings up the Help file.
 Hides the form.
X-bar Tab
Median Tab
X Tab
R Tab
s Tab
p Tab
np Tab
c Tab
u Tab