Main Form
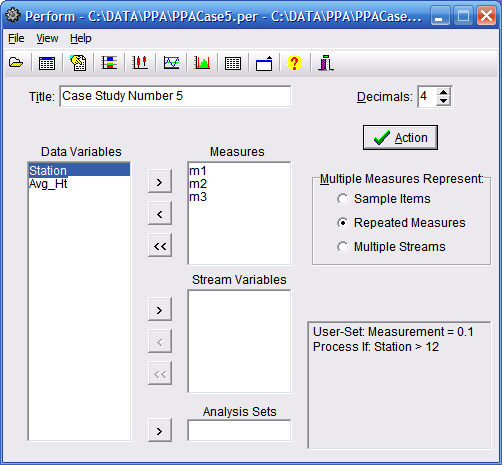
The Main Form is displayed upon opening PERFORM, as shown below.

Main Menu
File:
- New: Clears and opens the Data Editor.
- Open: Opens a Data File or PERFORM Configure File.
- Save: Saves a Data File or PERFORM Configure File.
- Save As: Saves a Data File or PERFORM Configure File with a new name.
- User-Set Std Dev: Sets User-Set Standard Deviations.
- Process If: Calls up the Process If dialog box.
- Exit: Exists PERFORM.
- Data Editor: Opens the Data Editor.
- Next Visible Form: Displays the next visible PERFORM form
- Next Open Form: Displays the next open PERFORM form, which may not be visible
- Text Output: Displays the Text Output.
- Performance Charts: Displays Performance Charts.
- Box & Whisker Plots: Displays Box & Whisker Plots.
- X-Charts: Displays X-Charts.
- Histogram: Displays Histogram.
- Frequency Plots: Displays Frequency Plots.
- Contents: Displays Help Table of Contents.
- introduction: Brings up Help introduction to PERFORM.
- Main Form: Brings up Help on Main Form (This Page).
- MVP Programs WEB Site: Calls up the MVP Programs WEB site.
- About: Brings up About Box with Version and Serial Number.
Speed Buttons
 Opens a Data File or PERFORM Configure File.
 Displays the Data Editor.
 Displays the Text Output.
 Displays the Performance Charts.
 Displays the Box & Whisker Plots.
 Displays the Variables Control Charts Form.
 Displays the Histogram Form.
 Displays the Frequency Plots Form.
 Brings up this Help system.
 Exits the System
Title
A Title may be entered here and will be displayed on Charts and Text output.
Analysis Sets Variable Selection Button
Use this button to select the variable for Analysis Sets.
Analysis Sets Variable
The variable used to perform analysis by sets.
Decimal Places
Select the number of Decimal Places (0-9) to use in output
Caption
The program name followed by a PERFORM Configure File name, followed by the Data File name will be displayed here.
Data Variables
These are the available variables that may used in analysis. One variable will be seen for each column in the Data Editor. See also, Data File Layout.
Measures
Variables selected to be used in analysis. These are the variables that represent measurements.
Grouping Variables
These variables are grouping variables used to define process streams.
Selection Buttons
> Selects Data Variables.
< Moves Variables back.
<< Moves All Variables back.
< Moves Variables back.
<< Moves All Variables back.
Action Button
Clicking this button generates a performance analysis. The Text Output will be displayed along with the Performance Charts.
Multiple Measures Represent
This selection appears when multiple variables are entered into the Measures box. Three selections are available:
- Sample Items:
- Select if multiple measures represent multiple items in a sample.
- Repeated Measures:
- Select Select if multiple measures represent repeated measures of the same item.
- Multiple Streams:
- Select if multiple measures represent multiple process streams. (Cannot be used with grouping variables.)
Configure Information
This display will appear if the following data modifications are active: User-Set Standard Deviations, Missing Values, Process If settings, or Transforms.
