Variables Chart Setup Form
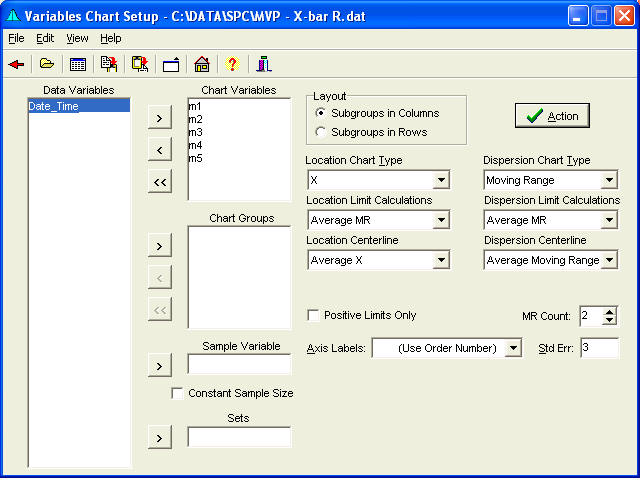
The following form is used to configure Variables Control Charts. You can select the Location chart type (X, Mean, Median, or None) and the Dispersion chart type (Range, Moving Range, Standard Deviation, Variance, or None). The method to used to calculate control limits, the centerlines, axis labels, and the number of standard errors to use may be selected. Chart calculations can be divided by sets.
There are various configurations available for the file layout. Subgroups can be in rows, in columns indexed by a sample variable, in columns indexed by a specific point count, or individual values in single columns. In addition, data for several charts can be included in a single file. Charts can be distinguished by being in separate columns or by grouping variables.
The recommended selection order is to select the Location Chart type, then the Dispersion Chart type, and then the Dispersion Limit Calculations. This is because selecting the Dispersion Chart type and Dispersion Limit Calculations automatically change the Location calculations to match. The Location Limits can the be changed if desired.
Menu
- File: Open or edit a data file, select the Process If options, or return to the Main Form.
- Edit: Copies or pastes selected text.
- View: Provides the ability to enlarge the Form size for easier viewing.
- Help: Calls up this file.
Speed Buttons
 Returns to the Main Form.
 Opens a Data File.
 Displays the Data Editor.
 Copies Selection to the clipboard.
 Pastes text from the clipboard
 Enlarges/Reduces Form size for easier viewing.
 Brings up the Main Form.
 Brings up the Help file.
 Hides the form.
Data Variables
Variable Selection Buttons
Chart Variables
Chart Groups
Sample Variable
Constant Sample Size Check Box
Set Variable
Sets do not need to be contiguous. In other words, values with Set=1 can be followed by values with Set=2, which can be followed by values with Set=1. All values with Set=1 will then be used to generate the limits and centerlines for all values of Set=1. This will allow you to separate a middle section.
Layout of Variables
Location Chart Type
Location Chart Limit Calculations
- Select the method to generate the Location Chart Control Limits here.
- For X Charts:
- Average MR
- Median MR
- Standard Deviation
- Known Standard Deviation
- Centerline Only
- User Defined
- None
- Average Range
- Median Range
- Average Standard Deviation
- Median Standard Deviation
- Average Variance
- Average MR of the Means or Medians
- Median MR of the Means or Medians
- Standard Deviation of the Means or Medians
- Known Standard Deviation
- Centerline Only
- User Defined
- None
Location Centerline
Positive Limits Only Check Box
Action Button
Dispersion Chart Type
Dispersion Chart Limit Calculations
- For MR Charts:
- Average MR
- Median MR
- Standard Deviation
- Known Standard Deviation
- Centerline Only
- User Defined
- None
- For the Range, Standard Deviation, and Variance Charts:
- Average Range
- Median Range
- Average Standard Deviation
- Median Standard Deviation
- Average Variance
- Average MR of the Dispersion Statistic
- Median MR of the Dispersion Statistic
- Standard Deviation Dispersion Statistic
- Known Standard Deviation
- Centerline Only
- User Defined
- None
