McNemar's Test Of Change
McNemar's Test of Change is a two-sample dependent test for proportions. The test involves two evaluations of a single set of items, where each items falls into one of two classifications on each evaluation. If we use a Pass/Fail classification scheme, McNemar's Test evaluates the differences between the number that Passed on the first evaluation and Failed on the second, versus the number that Passed on the second evaluation and Failed on the first.
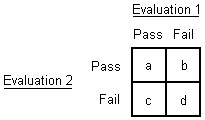
The frequencies corresponding to the two classifications and two evaluations may be placed in a 2 x 2 table as seen below. The cells of interest in this table are the b and c cells. In these cells, b and c, differences were found in the classifications from the first evaluation to the second. McNemar's Test evaluates the change in the number of misclassifications in one direction versus the number of misclassifications in the other. The comparison is then the number of observations falling in the b cell versus the number falling in the c cell.
Hypotheses
The following hypotheses may be tested:
![]()
Where ![]() is the population proportion that would Pass on the first evaluation and Fail on the second, and
is the population proportion that would Pass on the first evaluation and Fail on the second, and ![]() is the population proportion that would Pass on the second evaluation and Fail on the first.
is the population proportion that would Pass on the second evaluation and Fail on the first.
Assumptions
1. The samples have been randomly drawn from two dependent populations either through matching or repeated measures (Critical)
2. Each item evaluation yields one of two classifications (Critical)
3. Each observation is independent of every other observation, other than the given paired dependency (Critical)
Test Statistics
McNemar's Test of Change may be reduced to a One-Sample Binomial Test, with the following:
Let p = c/(b+c), and ![]() = 0.5
= 0.5
The exact or approximate One-Sample Binomial Test is then performed using these values.
Output
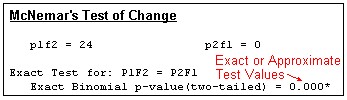
Note
The p-value is flagged with an asterisk (*) when p <= alpha.
kappa
kappa is a measure of agreement. While McNemar may reject the null hypothesis, the level of agreement may also be of interest.
The following statistics are output.
    Agreement
    Proportion Agreement        = 0.520
    Proportion Chance Agreement = 0.392
                    kappa (Max) = 0.211
                          kappa = 0.211
Here are the methods of calculation
- N=A+B+C+D [Total Sample Size]
- Po=(A+D)/N [Proportion Agreement]
- Pc=((A+B)*(A+C)+(C+D)*(B+D))/N/N [Proportion Chance Agreement]
- Pom=(Minimum(A+C,A+B)+Minimum(B+D,C+D))/N
- kappa (Max)=(Pom-Pc)/(1-Pc) [Maximum value of kappa, given marginal values]
- kappa=(Po-Pc)/(1-Pc)
