The t Distribution is a continuous random sampling distribution, similar to the z distribution, but also reflects sampling error regarding the standard deviation. The t distribution is used to test numerous forms of hypotheses. If we let Z be distributed as a Normal distribution, and Q be Distributed as a Chi-Square distribution with v degrees of freedom, and Q and Z be independent, then

has a t distribution with v degrees of freedom.
If we let X, be a random variable from a Normal population, with mean, μ, and standard deviation, σ. Then

has a t distribution with n-1 degrees of freedom.
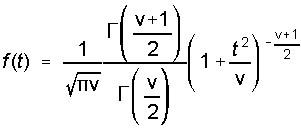
The t Distribution has a mean of zero and a variance of v/(v-2). The equation defining the t distribution curve is:

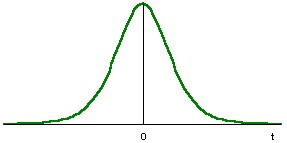
The t distribution has the following shape, which will be a function of the degrees of freedom, v.

As the degrees of freedom increase, the t distribution becomes closer and closer to that of a z distribution.