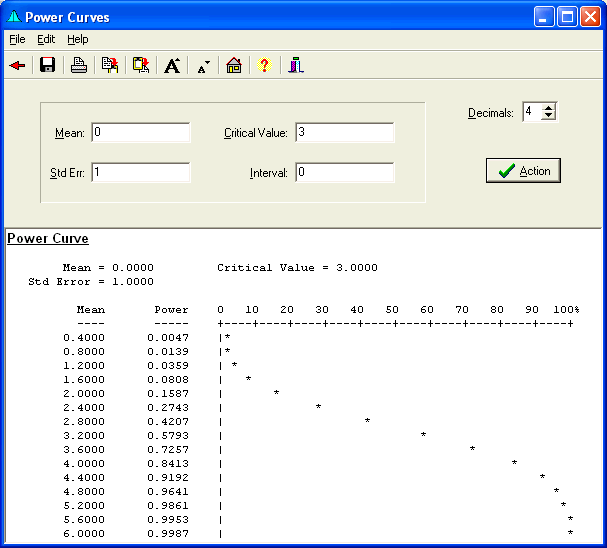
Power Curves generate generic Power Curves for tests given a Mean, Standard Error, and Limit. An Interval Size may also be selected. The output provides the Power for various alternative Means and displays the Power with a Character Plot.

Menu
- File provides the ability Save or Print the output, or return to the Main Form.
- Edit allows Editing Output Text by cutting, copying, pasting, and undoing entry.
- View provides the ability to enlarge/reduce the Form size for easier viewing.
- Help provides access to this Website.
Speed Buttons
These buttons provide quick access to the following tasks.
 Returns to last Form or the Main Form.
 Saves the output to a file.
 Prints the Text.
 Copies Selection to the clipboard.
 Pastes Text from the clipboard
 Increases the Font.
 Decreases the Font.
 Brings up the Main Form.
 Brings up the Help file.
 Hides the form.
Action Button
Performs calculations and displays output.
Decimal Place Change
Changes the number of decimal places, from 0 to 9. Change may be made by selecting and typing in the number, or by using the incrementing buttons.
Output Text
The calculation output is displayed here when  is clicked. You may save, print, edit, cut, copy, and paste text in this area.
Hypothesized Mean
Enter the hypothesized mean here, or leave it at zero plot power for relative differences.
Standard Error
Enter the standard error here.
Critical Value
Enter the Critical Value or rejection point here. This is the value in which the null hypothesis is rejected.
Interval
Enter the interval used to generate the point on the power curve here.
"0" is the default, which will generate 15 intervals between the Mean and six standard Errors.