A Geometric Distribution is a discrete Random Sampling Distribution. The sampling is from a series of independent trials each of which may have outcomes which fall into one of two classifications. The Geometric Distribution generates the probability of X-trials required until the first occurrence is obtained. The probability of occurrence of each classification remains constant for each trial. The outcomes of each successive trial also remains independent. This sampling situation is sometimes referred to as a Bernoulli Trial or Process.
Calculations
The probability of exactly X trials required to obtain the first occurrence may be calculated by the following formula.
![]()
Where:
- X is the number of Trials, and
 is the probability of occurrence.
Other Properties
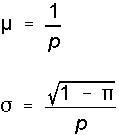
The Geometric Distribution has a Mean and a standard deviation as follows.

example
Here is an example Geometric Distribution, assuming a probability of occurrence of 0.5. The probability of 8 trials before an occurrence is observed is 0.0039, as seen in the table below.
Geometric Distribution
      p = 0.5    E(x)=2.00

    Prob       Equal &     Equal &

   r      at r        Above       Below
   1      0.5000      1.0000      0.5000 |-----------------------------------
   2      0.2500      0.5000      0.7500 |------------------
   3      0.1250      0.2500      0.8750 |---------
   4      0.0625      0.1250      0.9375 |----
   5      0.0313      0.0625      0.9688 |--
   6      0.0156      0.0313      0.9844 |-
   7      0.0078      0.0156      0.9922 |-
   8      0.0039      0.0078      0.9961 |
   9      0.0020      0.0039      0.9980 |
  10      0.0010      0.0020      0.9990 |
  11      0.0005      0.0010      0.9995 |
  12      0.0002      0.0005      0.9998 |
  13      0.0001      0.0002      0.9999 |
  14      0.0001      0.0001      0.9999 |
  15      0.0000      0.0001      1.0000 |
  16      0.0000      0.0000      1.0000 |
   \          \           \           \
 Inf.     0.0000      0.0000      1.0000 |