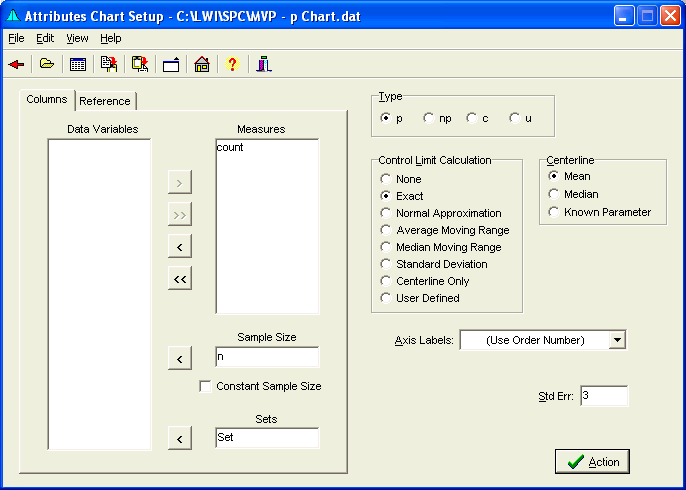
The following form is used to configure Attributes Control Charts. On this form you can select the type of chart (p, np, c, or u), the method to use to calculate control limits and the centerline, axis labels, and the number of standard errors to use.

Column/Reference Selection
- The Columns tab allows selection of multiple variables in separate columns.
- The Reference tab allows selection of a single variable grouped by multiple variables.
Speed Buttons
These buttons provide quick access to the following tasks.
 Returns to the Main Form.
 Opens a Data File.
 Displays the Data Editor.
 Copies Selection to the clipboard.
 Pastes text from the clipboard
 Enlarges/Reduces Form size for easier viewing.
 Brings up the Main Form.
 Brings up the Help file.
 Hides the form.
Menu
- File: Open or edit a data file, select the Process If options, or return to the Main Form.
- Edit: Copies or pastes selected text.
- View: Provides the ability to enlarge the Form size for easier viewing.
- Help: Calls up this file.
Control Chart Type
There are four type of control charts that may be selected. These are as follows.
- p chart for binomial proportion data
- np chart for binomial count data
- c chart for Poisson count data
- u chart for Poisson ratio data
Data Variables
The data variables found in the data editor will be displayed here.
Measures
The variables selected for analysis will be displayed here. The measures must be counts.
Sample Size
Either a variable will be displayed here that will be used for the sample size, or a number can be entered here when the Constant Sample Size check box is checked.
Set Variable
This variable is used to separate the analysis by sets. When a variable is selected, a vertical bar will be found between each set on the control chart. Separate control limit and centerline calculations will be generated for each set.
Sets do not need to be contiguous. In other words, values with Set=1 can be followed by values with Set=2, which can be followed by values with Set=1. All values with Set=1 will then be used to generate the limits and centerlines for all values of Set=1. This will allow you to separate a middle section.
Constant Sample Size Selection
Check this box to allow entry of a constant sample size. When checked no sample size variables can be used and the number entered will be used for the sample size.
If a c chart is being generated, and the sample size is constant, a "1" can be entered here for the sample size.
Selection Buttons
These buttons are used to select or deselect the data variables for analysis.
Sample Size Selection
This button is used to select the variable that represents the sample size.
Set Selection Button
Use this button to select a variable to separate the analysis by sets. When a variable is selected, a vertical bar will be found between each set on the control chart. Separate control limit and centerline calculations will be generated for each set.
Sets do not need to be contiguous. In other words, values with Set=1 can be followed by values with Set=2, which can be followed by values with Set=1. All values with Set=1 will then be used to generate the limits and centerlines for all values of Set=1. This will allow you to separate a middle section.
Control Limit Calculation Method
The following methods may be selected to generate the control limits.
- None
- Exact Binomial or Poisson
- Normal Approximation of the Binomial or Poisson
- Average Moving Range of the plotted values
- Median Moving Range of the plotted values
- Standard Deviation of the plotted values
- Centerline only
- User defined limits
Centerline Calculation Method
Three methods may be selected for centerline calculation.
- Mean of the plotted values
- Median of the plotted values
- Known Parameter: Pi or Lambda
Axis Labels
Any variable may be selected to be displayed as X-axis labels. For example, the set number or the count values could be used. This can also be used for a date variable entered as a real number, such as 10.12 for October 12.
Standard Error
The standard error to be used in the control limit calculations may be entered here.
Action Button
Clicking the action button will configure the Attributes control chart and display the chart on the Attributes Chart Form.