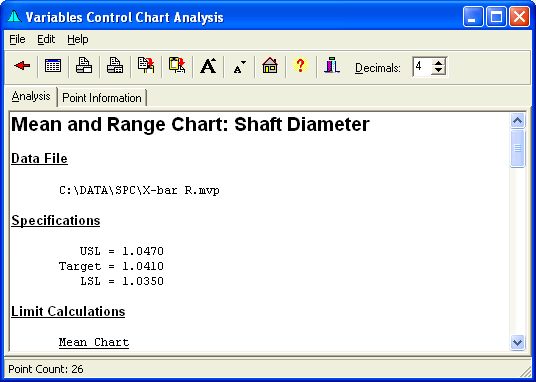
This form displays information about a specific control chart. Analysis is performed and output here. In addition, you can get specific information about each point.

Menu
- File: Prints the Text or Grid or returns to the Control Chart Form.
- Edit: Copies or pastes selected text, and increases/decreases font size.
- Help: Calls up this file.
Speed Buttons
- These buttons provide quick access to the following tasks.
 Returns to Variable Chart Form.
 Displays the Data Editor.
 Prints the Text.
 Prints the Grid.
 Copies Selection to the clipboard.
 Pastes Text from the clipboard
 Increases the Font.
 Decreases the Font.
 Brings up the Main Form.
 Brings up the Help file.
 Hides the form.
Decimal Place Change
Changes the number of decimal places, from 0 to 9. Change may be made by selecting and typing in the number, or by using the incrementing buttons.
Analysis Text Output
The control chart analysis is displayed here. The following categories will be shown.
- Data File
- Specifications
- Limit Calculations
- Control Analysis
- Capability and Performance Analysis
- Mean/Range Correlation
- Oneway ANOVA
Status Bar
The status bar displays the total point count for the chart.
Analysis Tab
This tab displays the text output of the chart analysis.
Point Information Tab
This tab outputs information about each point. (See Point Information Tab.)