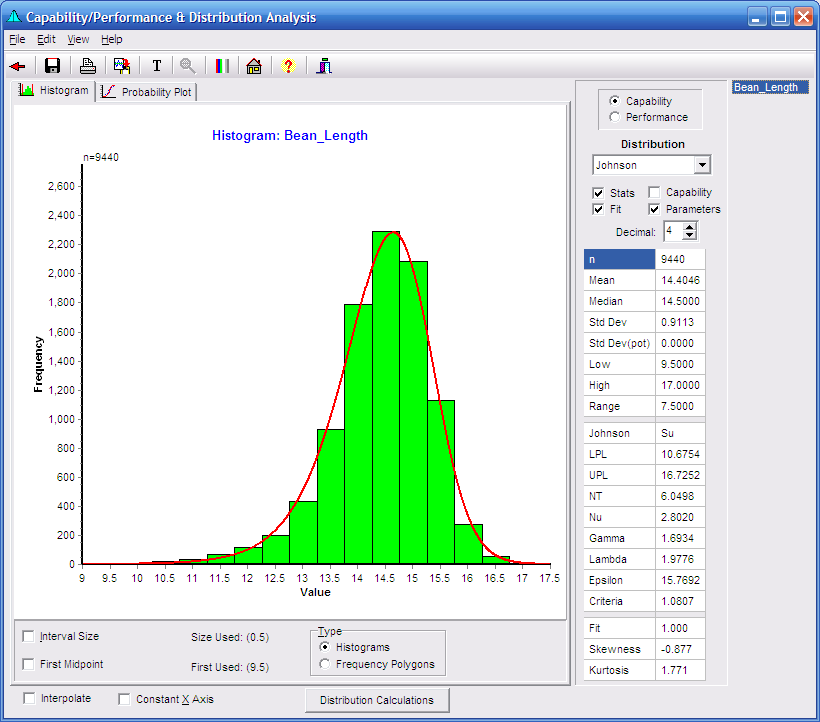
This form will perform Capability Analysis, Performance Analysis, and Distribution Analysis.
Distribution Analysis
This form will allow you to fit you data to the following distributions.
- None — No distribution fit.
- Normal — The data is fit with a Normal distribution.
- Exponential (0) — The data is fit with an Exponential distribution, using "0" as the lower bound.
- Exponential (Low) — The data is fit with an Exponential distribution, using lowest value as the lower bound.
- Weibull (2 Param) — The data is fit with a 2-Parameter Weibull distribution.
- Uniform — The data is fit with a Uniform distribution.
- Johnson — The data is fit with a Johnson Distribution, SU, SB, or SL.
- Gamma (0) — The data is fit with a Gamma distribution, using "0" as the lower bound.
- Gamma (Low) — The data is fit with a Gamma distribution, using lowest value as the lower bound.
- Beta — The data is fit with a Beta distribution.
- Rayleigh(0) — The data is fit with a Rayleigh distribution, using "0" as the lower bound.
- Rayleigh(Low) — The data is fit with a Rayleigh distribution, using the lowest value as the lower bound.
Capability Analysis
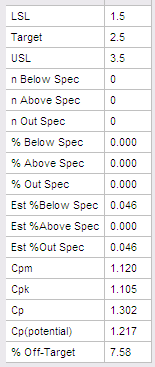
When specifications are entered, a distribution fit is selected, and the Capability is checked, the following table will be displayed.
Performance Analysis
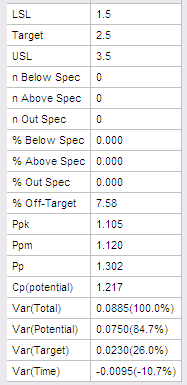
When specifications are entered and the Performance is checked, the following table will be displayed.
Probability Plot
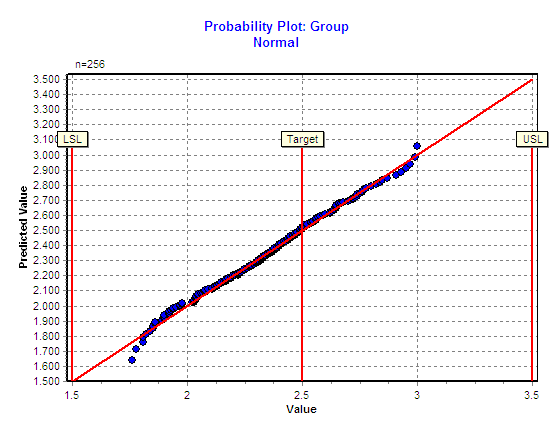
When the Probability Plot tab is selected the following will be displayed.
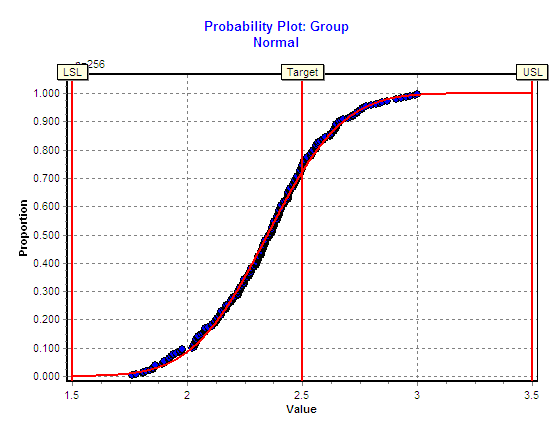
When the Linear checkbox is checked the plot will be linearized as follows.
Distribution Calculations
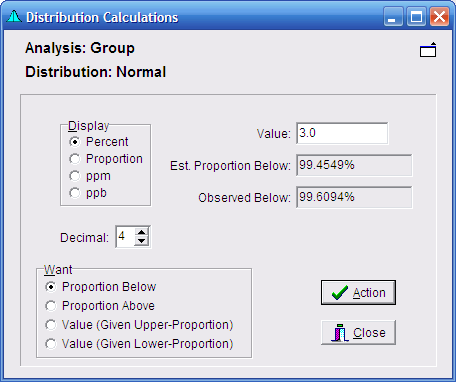
When the Distribution Calculations button is clicked, the following form will be displayed. This form will display observed and calculated tail-areas, or values for a given proportion.
Menu
- File: Provides ability to save or print the chart.
- Edit: Copies the chart (which also may be achieved by double clicking on the chart), and edit the chart titles.
- View: Zoom out after zooming, toggle black-and-white display, use relative frequencies, display process limits, display specifications, or add file modifications to the chart.
- Help: Calls up this Web page.
Speed Buttons
 Returns to the Attributes Chart Setup Form.
 Saves the graph to a file.
 Prints the graph.
 Copies the graph to the clipboard.
 Edits the Graph Titles.
 Zooms out the graph following a Zoom.
 Toggles between Color and Black & White
 Brings up the Main Form.
 Brings up the Help file.
 Hides the form.
Histogram Tab
Probability Plot Tab
Histogram/Frequency Polygon
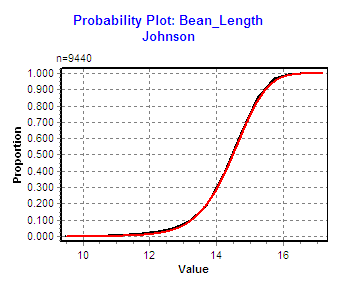
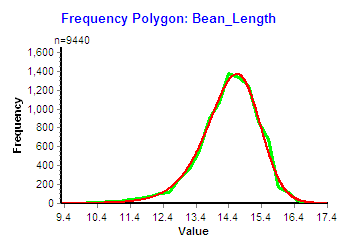
- Frequencies or Relative frequencies may be selected for the Y-Axis.
- The values are displayed along the X-Axis.
- Double Click the chart to copy it to the clipboard.
- Click the title to edit it.
Interval Size
First Midpoint
Histogram Interval Size Used
First Midpoint Used
Histogram-Frequency Polygon Selection
Interpolate
Constant X-Axis
Distribution Calculations
Analysis Variables
Capability/Performance Selection
Distribution Selection
- None — No distribution fit.
- Normal — The data is fit with a Normal distribution.
- Exponential (0) — The data is fit with an Exponential distribution, using "0" as the lower bound.
- Exponential (Low) — The data is fit with an Exponential distribution, using lowest value as the lower bound.
- Weibull (2 Param) — The data is fit with a 2-Parameter Weibull distribution.
- Uniform — The data is fit with a Uniform distribution.
- Johnson — The data is fit with a Johnson Distribution, SU, SB, or SL.
- Gamma (0) — The data is fit with a Gamma distribution, using "0" as the lower bound.
- Gamma (Low) — The data is fit with a Gamma distribution, using lowest value as the lower bound.
- Beta — The data is fit with a Beta distribution.
- Rayleigh(0) — The data is fit with a Rayleigh distribution, using "0" as the lower bound.
- Rayleigh(Low) — The data is fit with a Rayleigh distribution, using the lowest value as the lower bound.
Stats Checkbox
Fit Checkbox
Capability Checkbox
Parameters Checkbox
Decimal Place Selection
Statistics
Distribution Parameters
Distribution Fit
Display
- Percent
- Proportion
- ppm (Parts per million)
- ppb (Parts per billion)
Decimal Places
Want
- Proportion Below
- Proportion Above
- Value (Given Upper-Proportion)
- Value (Given Lower-Proportion)