The following shows how the Six Sigma Index compares with Process Performance and the ppm Index.
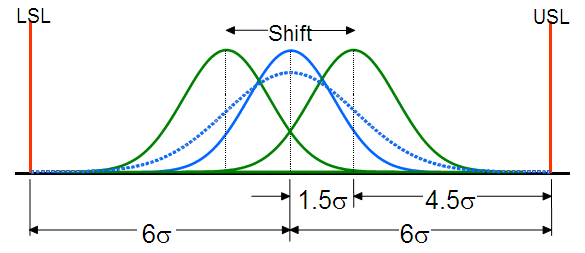
Assume the true mean randomly shifts with a standard deviation of 0.5σ then
Assuming the process is centered within the specifications (ppm will equal pp). ppm can be calculated using the long-term sigma, 1.118σ, as follows. Our spec range, per the above diagram is 12σ.
A ppm of 1.79 could be considered equivalent to Six Sigma.
The following table shows an equivalent Ppm for various values of the Six Sigma Index.
| ppm | 6σ Index |
|---|---|
| 0.89 | 3 |
| 1.19 | 4 |
| 1.49 | 5 |
| 1.79 | 6 |
| 2.09 | 7 |
| 2.39 | 8 |
| 2.68 | 9 |
| 2.98 | 10 |