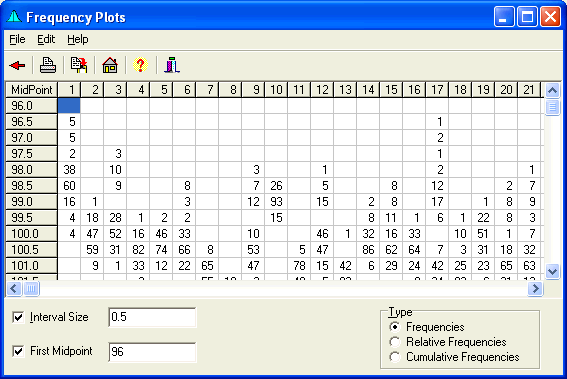
Frequency Plots are a tool, developed by Michael Petrovich, to display tables of frequencies, relative frequencies, or cumulative frequencies of groups in a data set. Selecting Frequency Plot will bring up the following form. Click items on this picture to see their function.
Menu
Menu to select options to Print, Copy, and obtain Help.
Speed Buttons
The buttons provide quick access to common tasks. Clicking these buttons do the following tasks:
 Returns to the Main Form.
 Prints the Frequency Plot.
 Copies the Frequency Plot to the clipboard.
 Brings up the Main Form.
 Brings up the Help file.
 Hides the form.
Variable Names/Levels
The variable names or levels are displayed here.
Interval Midpoints
The Midpoints of each interval for the row are displayed here.
Frequency Plot Grid
The Plot of Frequencies, Relative Frequencies, or Cumulative Frequencies are displayed here. These are plotted by midpoints by variable/level.
To move from Cell to Cell within the plot, see Moving from Cell To Cell.
Frequency Plot Interval Size Selection
An optional Interval Size may be entered into this box. Entering a value of zero generates a Frequency Plot using the default interval size.
Frequency Plot Type
Three types of Frequency Plots may be selected:
Frequencies: The number of observations falling into each cell are displayed.
Relative Frequencies: The proportion of observations falling into each cell are displayed.
Cumulative Frequencies: The cumulative proportion of observations falling into each cell are displayed.
First Interval
The first interval used may be set here. If greater than the smallest value, a smaller value will be used that is a multiple of the interval size selected and which will generate an interval midpoint of the selected value.