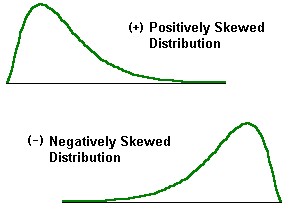
Skewness is the degree of departure from symmetry of a distribution. A positively skewed distribution has a "tail" which is pulled in the positive direction. A negatively skewed distribution has a "tail" which is pulled in the negative direction.

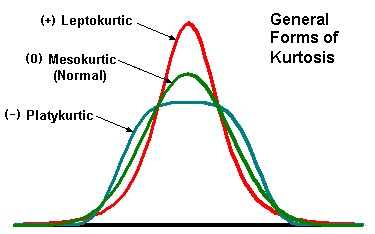
Kurtosis is the degree of peakedness of a distribution. A normal distribution is a mesokurtic distribution. A pure leptokurtic distribution has a higher peak than the normal distribution and has heavier tails. A pure platykurtic distribution has a lower peak than a normal distribution and lighter tails.

Most departures from normality display combinations of both skewness and kurtosis different from a normal distribution.
Calculating Skewness and Kurtosis
There are many methods for calculating skewness and kurtosis indices. Not all computer programs calculate Skewness and Kurtosis the same way. If you use a computer program to obtain skewness and kurtosis indices be sure you know how it calculates them!
There are measures of skewness such as Pearson's second coefficient of skewness, which is simply three times the mean minus the median divided by the standard deviation. There are also skewness indices which look at the quartiles, and many others. The most important group of measures of skewness and kurtosis use the third and fourth moments about the mean.
The moments about the mean are simply the sum of [each observed value minus the mean] raised to some power and divided by the sample size. In algebraic form, the rth moment about the mean is:

The second moment about the mean is simply the variance.
The Moment Coefficient of Skewness, denoted by statisticians as g3, is defined in dimensionless form as:

The expected value of this statistic will be zero for symmetrical distributions.
And similarly, the Moment Coefficient of Kurtosis, denoted by statisticians as g4, is defined in dimensionless form as:

This expected value of this statistic will be zero for Normal distributions.
These are the Skewness and Kurtosis formulas that are used by MVPstats, and programs such as SPSS, and Excel.
Critical Values
The critical value tables for Skewness and Kurtosis may be found on this Website. (See Skewness Critical Values, and Kurtosis Critical Values.) These tables have been generated to match the formulas above. Note that other tables exist which do not match these formulas, and using them would be misleading.
Using the Critical Value Tables and p-values
The tests for skewness and kurtosis are two-sided tests. The null hypothesis to be tested is that the skewness and kurtosis values are zero. The alternative hypothesis generally are that skewness and kurtosis are not equal to zero.
The critical value tables, found on this Website, provide the critical values for different selections of alpha, for various sample sizes.
For skewness, if the absolute value is equal or exceeds the critical value for your level of confidence, reject the assumption of normality.
For kurtosis, if the kurtosis value is greater than or equal to the high critical value, or is less than or equal to the low critical value, reject the assumption of normality.
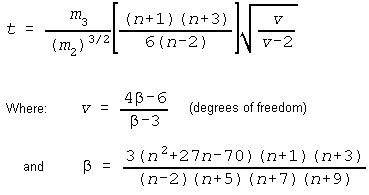
MVPstats displays p-values for skewness based on a t-distribution where (D'Agostino and Tietjen, 1971):

The 't' approximation has an error in p-value no more than 1/2 percent below samples sizes of 20, compared to the published values. It is actually better (1/10 percent error) for small alpha (0.01-0.02) in this range. In the range 20-35 it has an error not greater than 1/10 percent. Above samples of size 40, the p-value is essentially exact.
The kurtosis random sampling distribution is difficult to model, so p-values cannot be calculated. The program simply looks up in the table and displays the range of the significance. Sample sizes greater than 5,000 use the Normal approximation of the Kurtosis random sampling distribution to generate p-values.