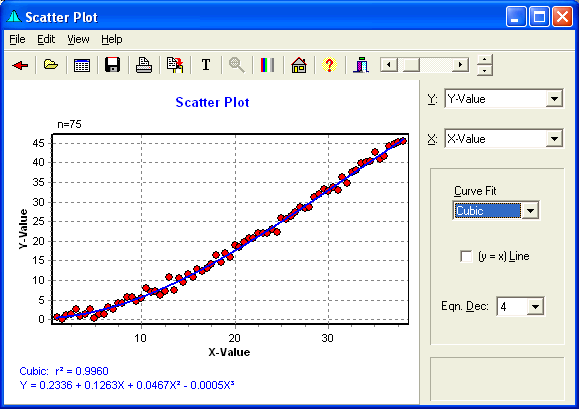
Scatter Plot
The Scatter Plot form generates a graph showing the relationship between two variables. One of Ten Curve Fit equations may be selected to fit the data. The r-squared value will be displayed. In addition, a Y=X line may be displayed, which is useful for paired analysis. Double-clicking on the graph will copy the graph to the clipboard.
Scatter Menu
- File provides the ability to Open a Data File, View the Data Editor, Print the Chart, or return to the Main Form.
- Edit allows copying the Chart or Equation to the Windows Clipboard, or Editing the Chart Titles.
- View allows Zooming Out the Chart, Setting the Graph to Black & White, Adding File Modifications to the Chart, or Adding the Curve Fit Equation to the Chart.
- Help provides access to this Website.
Speed Buttons
The buttons provide quick access to common tasks. Clicking these buttons do the following tasks:
 Returns to the Explore Form.
 Opens a Data File.
 Displays the Data Editor.
 Saves the chart to a file.
 Prints the chart.
 Copies the chart to the clipboard.
 Edits the Titles
 Zooms out the chart following a Zoom.
 Toggles between Color and Black & White.
 Brings up the Help file.
 Hides the form.
Scatter Chart
The Scatter Plot is displayed here.
Curve Fit Equations
The r-squared value and the Curve Fit Equation will be displayed here.
Scatter Y-Value
Select the Y-Value here from the drop-down list.
Scatter X-Value
Select the X-Value here from the drop-down list.
Curve Fit Equation Selection
Select from the possible list below:
- None
- Linear: Y=A+BX
- Exponential: Y=Aexp(BX)
- Logarithmic: Y=A+Bln(X)
- Power: Y=A*X^B
- Inverse: Y=A+B/X
- Compound: Y=A*B^X
- Growth: Y=exp(A+B*X)
- S: Y=exp(A+B/X)
- Quadratic: Y=A+BX+CX^2
- Cubic: Y=A+BX+CX^2+DX^3
- 4th Order: Y=A+BX+CX^2+DX^3+EX^4
- 5th Order: Y=A+BX+CX^2+DX^3+EX^4+FX^5
Y=X Line
Check this box to plot a Y=X line.
Point Size
Move the slider to change the size of the plotted points.
Sample Size
The sample size will be displayed here.
Line Thickness Control
The line thickness can be changed by clicking these up and down buttons.
Scatter Title
The title will be added here. The default title is "Scatter Plot." This title may be edited.
Equation Decimal Places
Select the number of decimals places to be used in the display of a fitted equation and the r-squared value.
Point Values
The X and Y values of a point will be displayed here when the cursor is over the point. The cursor will display as a cross (+) when over the point.
