Plot - Form
Box & Whisker Plots with or without Outliers, Mean Plots (Confidence Intervals), Natural Tolerances, Tukey Critical Mean Differences, and Least-Significant Differences (equivalent to critical differences for a two sample t-test) are displayed on the following form. Click items on this picture to see their function. Double-clicking on the graph will copy the graph to the clipboard.
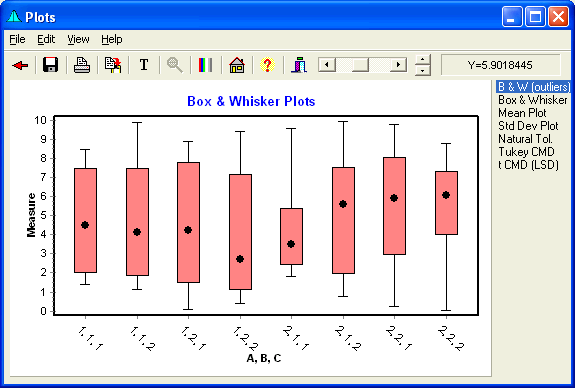
Chart Menu
- File allows Saving and Printing the chart, or Returning to the calling form.
- Edit allows Copying the chart or Editing the Titles.
- View allows the ability to Zoom Out, select Black & White colors, add File Modifications to the chart.
- Help calls up this Help file.
Speed Buttons
The buttons provide quick access to common tasks. Clicking these buttons do the following tasks:
 Returns to the Explore Form.
 Saves the chart to a file.
 Prints the chart.
 Copies the chart to the clipboard.
 Edits the Titles.
 Zooms out the chart following a Zoom.
 Toggles between Color and Black & White.
 Brings up the Main Form
 Brings up the Help file.
 Hides the form.
Plot Selection
Selects Box & Whisker Plots with or without Outliers, Mean Plots (Confidence Intervals), and Natural Tolerances. Pressing the Enter key or re-clicking will regenerate the chart, which is useful if using random transforms for simulation.
Graph Title
Title of the Graph. If a title is entered on the Main Form, this title will be added here.
Graph Group Name
Group variable names or levels will be shown here. If grouping variables are used, the levels of the grouping variables will be shown, otherwise the variable names will be shown.
Graph Scale
This is the plot scale.
Plot
The plot will be displayed here.
Box Width Slider
Sliding this control changes the box width.
Line Thickness Control
The line thickness can be changed by clicking these up and down buttons.
Point Info
The Y values of a point will be displayed here when the cursor is over a plotted point. The cursor will display as a cross (+) when over the point.
