Dispersion Data Generation
Four different methods for dispersion testing are available. These methods are the Bartlett-Kendall-Box Procedure, Barlett-Kendall Procedure, Absolute Deviations from the Median, and Absolute Deviations from the Mean (Levene's test). The routines take independent and dependent variables from the Data Editor, and generates a new dependent variable in an appended column in the Data Editor. This new dependent variable will be a function of each within cell, or unique Run combination, variability.
In addition, Deviations from the Median and Deviations from the Mean may be generated. This is sometimes useful for making comparisons among multiple groups. For example, with Deviations from the Median, multiple boxplots will be centered with their medians at zero.
Group statistics, including the median, mean, standard deviation, variance, and range also are available.
Bartlett-Kendall-Box Procedure
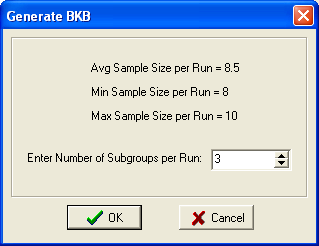
This procedure generates random subgroups within each Run combination of independent variables. The natural logs of the variances of each subgroup are then generated. The optimum number of subgroups is the square-root of the average sample size per Run. This is the default, and may be changed on the Form shown below. Note that each time a output set is generated, different values may be generated, with more than one subgroup, because the randomization generates different subgroups.
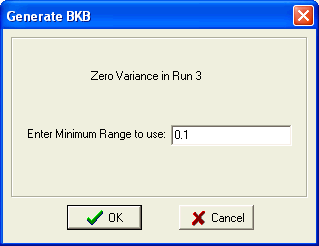
Should a subgroup be found that contains a subgroup with a zero variance, the first occurrence will display the following Form. This form allows the entry of the Minimum Range to use in calculations. The recommended minimum Range is 1/10 the unit of resolution. A subgroup variance is generated using this minimum range and the number of values in the subgroup.
Bartlett-Kendall Procedure
By selecting only one subgroup in the Bartlett-Kendall-Box Procedure you will obtain the Bartlett-Kendall procedure. The Bartlett-Kendall procedure requires that the data be normally distributed. Serious errors occur if that assumption is violated. This test is based on the somewhat interesting fact that the random sampling distribution of natural logarithms of variances has a constant standard error, dependent only on sample size, regardless of the underlying population variability. This is only true if the population from which the sample is drawn can be approximated with the normal distribution. In other words, if one were to repeatedly draw out samples of a given size from some normally distributed population, and then were to calculated the variance of each sample, and the logarithm of each variance, the variability of those logarithms of variances would be the same for any normally distributed population with samples drawn of the same size. The variability that would result is only a function of sample size as follows:
| n | Variance of Ln(s2) |
|---|---|
| 5 | 0.645 |
| 6 | 0.490 |
| 7 | 0.395 |
| 8 | 0.330 |
| 9 | 0.284 |
| 10 | 0.249 |
| 11 or More | use 2/(n-2) |
If the assumption of normality cannot be met, use one of the other tests provided.
Absolute Deviations from the Median
This procedure generates the median for each Run combination, subtracts each value in the Run from the median, and then takes the absolute value of this number. When the Omit Median Value checkbox is checked the median point will will be omitted with an odd number of values, and one of the two middle values will be omitted with an even number of values. This will improve the control of Type I error rates with nonnormal data. Note that Average Absolute Deviations from the Median are less than Average Absolute Deviations from the Mean.
Absolute Deviations from the Mean
This procedure generates the mean for each Run combination, subtracts each value in the Run from the mean, and then takes the absolute value of this number. This procedure is also known as Levene's Test. Note that Average Absolute deviations from the mean are higher than Average Absolute Deviations from the Median.
