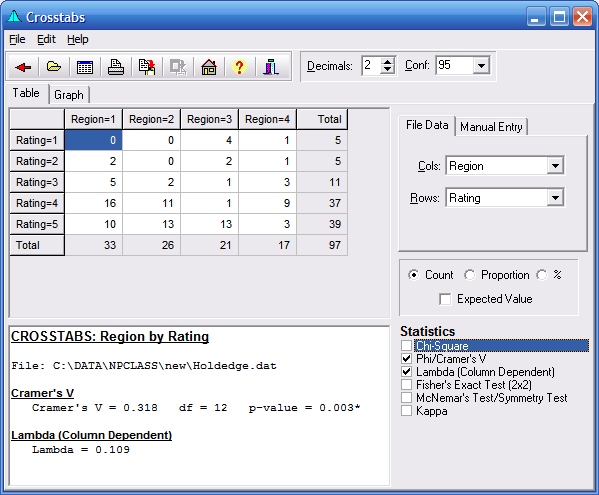
crosstabs displays the relationship of two variables in a two-way contingency table. A contingency table is a cross-classification of two or more variables. Each cell in the contingency table contains the joint frequencies for the variables A two-way table classifies two variables. The data should be nominal or ordinal for analysis. All combinations of the two variable are displayed. The frequencies are generated for each combination.
The form is very flexible. You may easily collapse columns or rows to combine categories. This is done by simply clicking on the rows or columns and highlighting them. Then right click  the mouse and select "Remove Columns" or "Merge Columns" if columns are selected. Select Remove Rows" or "Merge Rows" if rows are selected.
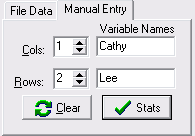
You may use File Data or Manual Entry to enter data into the cells. In manual mode, you simply select the number of columns or rows for the table.

Several statistics are available to analyze the data in the table. These include: Chi-Square, Phi/Cramer's V, Lambda (Column Dependent), Fisher's Exact Test (2x2), McNemar's Test/Symmetry Test, and kappa.
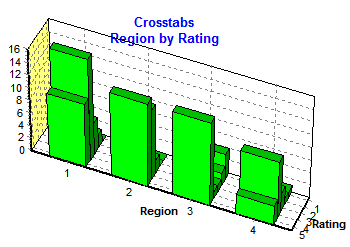
Clicking the Graph tab will display a 3-dimensional bar chart of the data.

Menu
- File provides the ability open a new file, Save or Print the output, access the Data Editor, or return to the Main Form.
- Edit provides ability to Copy the grid selection, or Select the entire grid with headings. Font size in the grids can be increased or decreased. Column widths may be minimized for greater column display.
- Help provides access to this Website.
Speed Buttons
 Returns to the last Form or the Main Form.
 Opens a Data File.
 Displays the Data Editor.
 Saves the output to a file.
 Prints the Text grid.
 Copies Selection to the clipboard.
 Brings up the Main Form.
 Brings up this Help file.
 Hides the form.
Decimal Place Change
Confidence Level
Table Tab
Graph Tab
Row Variable Levels
Column Variable Levels
Table Values
- Counts,
- Proportions, or
- Expected Values
Row Totals
Column Totals
File Data Tab
Manual Entry Tab
Change the row or column variable levels and the table will change size.
You can enter variable name to be displayed in the row and column headings.

Column Variable
Row Variable
Table Display Type
- Counts,
- Proportions, or
- Expected Values