Three measures of process capability are presented here. These are the Cp, Cpk, and Cpm.
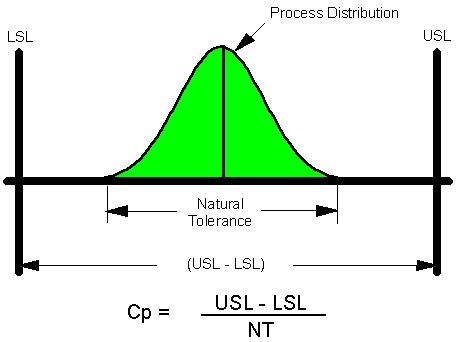
Cp
Cp measures the spread of the process distribution, compared against the specification range. The natural tolerance is defined as the middle 99.73% of the process distribution in long-term studies, and the middle 99.994% in short-term studies. For a normal distribution, this range is plus or minus 3 standard deviations for the long-term, and 4 for the short-term. Here is a diagram showing the Cp calculation.
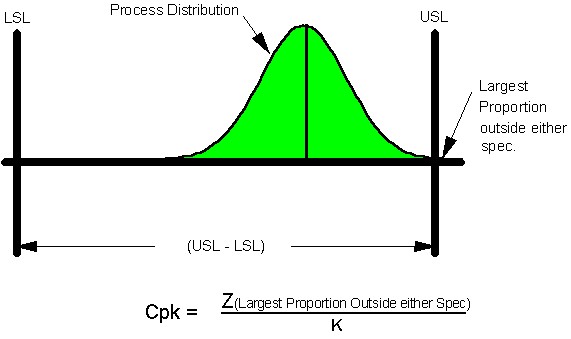
Cpk
Cpk is concerned with the closeness of the distribution to the specification limits, and the threat of producing nonconforming product. K, in the formula below would be 3 for long-term studies, and 4 for short term studies. Z is the z-score corresponding to the proportion outside either specification.
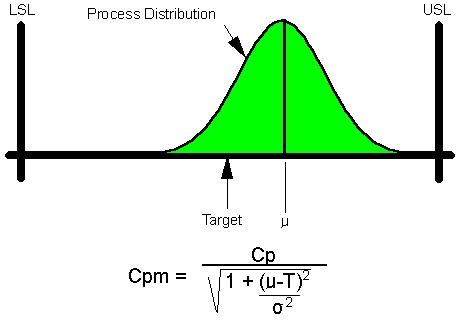
Cpm
Cpm is concerned with the variability from target. Its derivation is aligned with the Taguchi Loss Function, which says that losses in a manufacturing process increases by the square of the deviation from target. Economic losses are inversely related to this measure.