Assessing Potential Performance
An important assessment concerns the losses which arise from a lack of through-time stability or control. The standard deviations within process streams include any sources of through-time variability. The question to answer is, “If perfect through-time stability were achieved, how much variation would be observed?” To address this question, the minimum potential process variation,
![]() potential, may be estimated. Several approaches may be used for this estimation. Two common approaches are:
potential, may be estimated. Several approaches may be used for this estimation. Two common approaches are:
1) short-term capability studies, and
2) estimating variance within process streams using average or median dispersion statistics.
Short-term capability studies may be conducted to determine the inherent potential variation of the process. This may be done by generating one or more studies of relatively small samples of consecutive items and then estimating the potential variability. Preferably, multiple studies should be conducted at different points in time. These measures may then be entered into the software using User Set Standard Deviations.
Several approaches to estimate the potential variation may be employed when using data sampled over an extended period of time and where control may not be observed. One common approach is to remove individual “out-of-control” points and to estimate process variation from those points remaining. Unfortunately, this methodology is not feasible with large data sets.
Another approach to estimate the potential variation is to use averages or medians of dispersion statistics such as the range, moving range, or standard deviation. These average or median statistics may be used to generate an estimated ![]() by dividing by appropriate constants. Median dispersion statistics are more robust to significant shifts in the process than average dispersion statistics. Although there is more sampling error associated with median dispersion statistics, this is not an issue with a large number of samples, and is the method used by this software.
by dividing by appropriate constants. Median dispersion statistics are more robust to significant shifts in the process than average dispersion statistics. Although there is more sampling error associated with median dispersion statistics, this is not an issue with a large number of samples, and is the method used by this software.
The rate of sampling may influence the estimated potential variation. When using statistics which assess item to item variation, shorter time intervals between sampled items would generate lower estimates of potential variance. Sampling consecutive items would result in minimum estimates.
When multiple process streams are present, the potential variation for each process stream is estimated. In these cases, the average of the estimated standard deviations is used for estimating process potential, assuming potential variances are equal among process streams. If large differences exist in variation, separate analysis for each process stream may be desired.
Using the estimated potential variation, a measure of the potential capability of the process, Cp(potential), is calculated as follows.
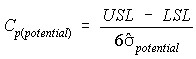
where
- USL is the Upper Specification Limit,
- LSL is the Lower Specification Limit, and
 potential is the estimated potential standard deviation.
![]() potential is estimated two ways in this software. For single values per sample within each stream, the Median Moving Range is used as shown in the following equation.
potential is estimated two ways in this software. For single values per sample within each stream, the Median Moving Range is used as shown in the following equation.

where
 is the median moving range, and
 is a constant equal to 0.954 (using moving ranges between two points).
When multiple items per sample are used the Median Standard deviation is used as shown in the following equation.
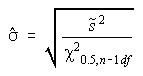
where
 is the median standard deviation, and
 is the Chi-square value for alpha=0.5, with n-1 degrees of freedom.
When multiple streams are present a weighted average standard deviation is generated. When the median moving range is used, each stream is weighted by (n-1). When median standard deviations are used, each stream is weighted by the number of subgroups.
This potential capability is the potential performance measure (ppm) that would be obtained if the process were brought into control, process stream variation was eliminated, and the process was brought on target.