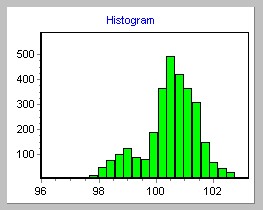
The term Histogram was coined by Karl Person near the end of the 19th century. Histograms provide a graphical display of a data set. They show where the values fall and provide an understanding of the data in terms of shape, spread, and location.
One axis displays the data set's measures or values, which may be grouped into intervals. Vertical bars display the frequency with which the values associated with each interval appear, and have a width equal to the interval size.